Sears 2010 Annual Report Download - page 28
Download and view the complete annual report
Please find page 28 of the 2010 Sears annual report below. You can navigate through the pages in the report by either clicking on the pages listed below, or by using the keyword search tool below to find specific information within the annual report.-
 1
1 -
2
-
3
-
4
-
5
-
6
-
7
-
8
-
9
-
10
-
11
-
12
-
13
-
14
-
15
-
16
-
17
-
 18
18 -
 19
19 -
 20
20 -
 21
21 -
 22
22 -
 23
23 -
 24
24 -
 25
25 -
 26
26 -
 27
27 -
 28
28 -
 29
29 -
 30
30 -
 31
31 -
 32
32 -
 33
33 -
 34
34 -
 35
35 -
 36
36 -
 37
37 -
 38
38 -
39
-
40
-
41
-
42
-
43
-
44
-
45
-
46
-
47
-
48
-
49
-
50
-
51
-
52
-
53
-
54
-
55
-
56
-
57
-
58
-
59
-
60
-
61
-
62
-
63
-
64
-
65
-
66
-
67
-
68
-
69
-
70
-
71
-
72
-
73
-
74
-
75
-
76
-
77
-
78
-
79
-
80
-
81
-
82
-
83
-
84
-
85
-
86
-
87
-
88
-
89
-
90
-
91
-
92
-
93
-
94
-
95
-
96
-
97
-
98
-
99
-
100
-
101
-
102
-
103
-
104
-
105
-
106
-
107
-
108
-
109
-
110
-
111
-
112
 |
 |

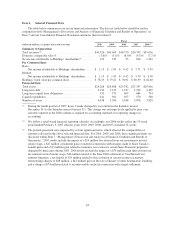
Business Segment Results
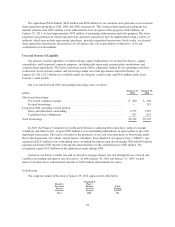
Kmart
Kmart results and key statistics were as follows:
millions, except for number of stores 2010 2009 2008
Merchandise sales and services ........................................ $15,593 $15,743 $16,219
Cost of sales, buying and occupancy .................................... 11,757 12,038 12,442
Gross margin dollars ................................................ 3,836 3,705 3,777
Margin rate ....................................................... 24.6% 23.5% 23.3%
Selling and administrative ............................................ 3,341 3,386 3,456
Selling and administrative expense as a percentage of revenues .............. 21.4% 21.5% 21.3%
Depreciation and amortization ......................................... 149 152 138
Impairment charges ................................................. — — 21
Gain on sales of assets ............................................... (7) (23) (10)
Total costs and expenses ......................................... 15,240 15,553 16,047
Operating income ................................................... $ 353 $ 190 $ 172
Total Kmart stores .................................................. 1,307 1,327 1,368
2010 Compared to 2009
Revenues and Comparable Store Sales
Kmart’s comparable store sales increased 0.7% while total sales declined 1.0% in 2010. The decline in total
revenues primarily reflects the impact of having fewer stores in operation. The comparable store sales increase
was primarily driven by increases in most categories, with higher increases in the apparel, footwear, jewelry,
sporting goods and toys categories, partially offset by declines in the food and consumable and pharmacy
categories.
Gross Margin
Kmart generated $3.8 billion in gross margin in 2010 and $3.7 billion in 2009. The $131 million increase is
mainly a result of a 110 basis point increase in margin rate and includes a $6 million charge recorded in cost of
sales for margin related expenses taken in connection with store closings in 2010. Gross margin for 2009
included a $27 million charge recorded in cost of sales for margin related expenses taken in connection with store
closings in 2009. Kmart’s margin rate increased to 24.6%, from 23.5% in 2009, in part as a result of an increase
in sales of higher margin categories such as apparel and sporting goods.
Selling and Administrative Expenses
Kmart’s selling and administrative expenses decreased $45 million to $3.3 billion in 2010 and included
incremental expenses of $24 million related to our continued investment in our multi-channel capabilities and the
launch of our Shop Your Way Rewards program. The decline in selling and administrative expenses primarily
reflects a reduction in payroll expenses of $16 million, a reduction in advertising expenses of $11 million, as well
as reductions in various other expense categories. Selling and administrative expenses include charges related to
store closings and severance of $7 million and $35 million, for 2010 and 2009, respectively, as well as a $17
million gain related to settlement of Visa/MasterCard antitrust litigation in 2009. Our selling and administrative
expense rate was 21.4% for 2010 and 21.5% in 2009, and decreased primarily as a result of the above noted
significant items.
28