Sears 2010 Annual Report Download - page 35
Download and view the complete annual report
Please find page 35 of the 2010 Sears annual report below. You can navigate through the pages in the report by either clicking on the pages listed below, or by using the keyword search tool below to find specific information within the annual report.
ANALYSIS OF CONSOLIDATED FINANCIAL CONDITION
Cash Balances
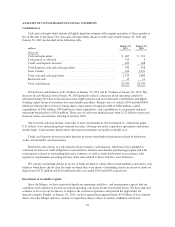
Cash and cash equivalents include all highly liquid investments with original maturities of three months or
less at the date of purchase. Our cash and cash equivalents balances at the years ended January 29, 2011 and
January 30, 2010 are detailed in the following table.
millions
January 29,
2011
January 30,
2010
Domestic
Cash and equivalents ............................................ $ 465 $ 221
Cash posted as collateral ......................................... 325 9
Credit card deposits in transit ..................................... 169 168
Total domestic cash and cash equivalents ........................... 959 398
Sears Canada .................................................. 416 1,291
Total cash and cash equivalents ................................... 1,375 1,689
Restricted cash ................................................ 15 11
Total cash balances ............................................. $1,390 $1,700
We had total cash balances of $1.4 billion at January 29, 2011 and $1.7 billion at January 30, 2010. The
decrease in cash balances from January 30, 2010 primarily reflects a decrease in net operating cash flows
generated during 2010 due to decreased income, higher pension and post retirement contributions and higher
working capital balances (inventory less merchandise payables). Primary uses of cash for 2010 included $603
million for the purchase of Sears Canada shares, repayments of long-term debt of $486 million, capital
expenditures of $441 million, $394 million for share repurchases, and contributions to our pension and post-
retirement benefit plans of $316 million. These uses of cash were funded in part from $1.25 billion of proceeds
from our senior secured notes offering in October 2010.
Our invested cash may include, from time to time, investments in, but not limited to, commercial paper,
U.S. federal, state and municipal government securities, floating-rate notes, repurchase agreements and money
market funds. Cash amounts held in these short-term investments are readily available to us.
Credit card deposits in transit include deposits in-transit from banks for payments related to third-party
credit card and debit card transactions.
Restricted cash consists of cash related to Sears Canada’s cash balances, which have been pledged as
collateral for letters of credit obligations issued under its offshore merchandise purchasing program and with
counterparties related to outstanding derivative contracts, as well as funds held in trust in accordance with
regulatory requirements governing advance ticket sales related to Sears Canada’s travel business.
We classify outstanding checks in excess of funds on deposit within other current liabilities and reduce cash
balances when these checks clear the bank on which they were drawn. Outstanding checks in excess of funds on
deposit were $122 million and $116 million for the year ended 2010 and 2009, respectively.
Investment of Available Capital
Since the Merger, we have generated significant operating cash flows, and management expects that our
cash flows will continue to exceed our annual operating cash needs for the foreseeable future. We have and will
continue to invest in our businesses to improve the customer experience and provide the opportunity for
attractive returns. Further, at January 29, 2011, we have repurchased approximately $5.8 billion of our common
shares since the Merger and may continue to repurchase shares subject to market conditions and board
35


