Sears 2010 Annual Report Download - page 51
Download and view the complete annual report
Please find page 51 of the 2010 Sears annual report below. You can navigate through the pages in the report by either clicking on the pages listed below, or by using the keyword search tool below to find specific information within the annual report.-
 1
1 -
2
-
3
-
4
-
5
-
6
-
7
-
8
-
9
-
10
-
11
-
12
-
13
-
14
-
15
-
16
-
17
-
18
-
19
-
20
-
21
-
22
-
23
-
24
-
25
-
26
-
27
-
28
-
29
-
30
-
31
-
32
-
33
-
34
-
35
-
36
-
37
-
38
-
39
-
40
-
 41
41 -
 42
42 -
 43
43 -
 44
44 -
 45
45 -
 46
46 -
 47
47 -
 48
48 -
 49
49 -
 50
50 -
 51
51 -
 52
52 -
 53
53 -
 54
54 -
 55
55 -
 56
56 -
 57
57 -
 58
58 -
 59
59 -
 60
60 -
 61
61 -
62
-
63
-
64
-
65
-
66
-
67
-
68
-
69
-
70
-
71
-
72
-
73
-
74
-
75
-
76
-
77
-
78
-
79
-
80
-
81
-
82
-
83
-
84
-
85
-
86
-
87
-
88
-
89
-
90
-
91
-
92
-
93
-
94
-
95
-
96
-
97
-
98
-
99
-
100
-
101
-
102
-
103
-
104
-
105
-
106
-
107
-
108
-
109
-
110
-
111
-
112
 |
 |

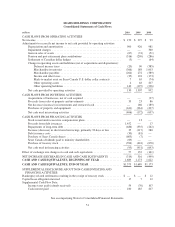
SEARS HOLDINGS CORPORATION
Consolidated Statements of Cash Flows
millions 2010 2009 2008
CASH FLOWS FROM OPERATING ACTIVITIES
Net income ........................................................... $ 150 $ 297 $ 99
Adjustments to reconcile net income to net cash provided by operating activities:
Depreciation and amortization ........................................ 900 926 981
Impairment charges ................................................ — — 360
Gain on sales of assets .............................................. (67) (74) (51)
Pension and post-retirement plan contributions ........................... (316) (209) (286)
Settlement of Canadian dollar hedges .................................. (3) — (64)
Change in operating assets and liabilities (net of acquisitions and dispositions):
Deferred income taxes .......................................... (20) 90 (385)
Merchandise inventories ........................................ (366) 188 1,003
Merchandise payables .......................................... (264) 272 (389)
Income and other taxes .......................................... (35) 101 (173)
Mark-to-market asset on Sears Canada U.S. dollar collar contracts ....... 7 65 (74)
Other operating assets .......................................... 4 48 207
Other operating liabilities ........................................ 140 (197) (236)
Net cash provided by operating activities ............................... 130 1,507 992
CASH FLOWS FROM INVESTING ACTIVITIES
Acquisitions of businesses, net of cash acquired .......................... — — (37)
Proceeds from sales of property and investments ......................... 35 23 86
Net decrease (increase) in investments and restricted cash .................. — 166 (189)
Purchases of property and equipment .................................. (441) (361) (497)
Net cash used in investing activities ................................... (406) (172) (637)
CASH FLOWS FROM FINANCING ACTIVITIES
Stock issued under executive compensation plans ......................... — 13 —
Proceeds from debt issuances ......................................... 1,452 — 17
Repayments of long-term debt ........................................ (486) (335) (262)
Increase (decrease) in short-term borrowings, primarily 90 days or less ....... 35 (117) 280
Debt issuance costs ................................................. (30) (81) —
Purchase of Sears Canada shares ...................................... (603) (7) —
Sears Canada dividends paid to minority shareholders ..................... (69) — —
Purchase of treasury stock ........................................... (394) (424) (678)
Net cash used in financing activities ................................... (95) (951) (643)
Effect of exchange rate changes on cash and cash equivalents ................... 57 132 (161)
NET INCREASE (DECREASE) IN CASH AND CASH EQUIVALENTS ........ (314) 516 (449)
CASH AND CASH EQUIVALENTS, BEGINNING OF YEAR ............... 1,689 1,173 1,622
CASH AND CASH EQUIVALENTS, END OF YEAR ...................... $1,375 $1,689 $1,173
SUPPLEMENTAL DISCLOSURE ABOUT NON-CASH INVESTING AND
FINANCING ACTIVITIES:
Bankruptcy related settlements resulting in the receipt of treasury stock ........... $ — $ — $ 12
Capital lease obligation incurred .......................................... 17 7 12
Supplemental Cash Flow Data:
Income taxes paid (refunds received) .................................. 59 (70) 107
Cash interest paid .................................................. 180 185 207
See accompanying Notes to Consolidated Financial Statements.
51