Sears 2010 Annual Report Download - page 49
Download and view the complete annual report
Please find page 49 of the 2010 Sears annual report below. You can navigate through the pages in the report by either clicking on the pages listed below, or by using the keyword search tool below to find specific information within the annual report.-
 1
1 -
2
-
3
-
4
-
5
-
6
-
7
-
8
-
9
-
10
-
11
-
12
-
13
-
14
-
15
-
16
-
17
-
18
-
19
-
20
-
21
-
22
-
23
-
24
-
25
-
26
-
27
-
28
-
29
-
30
-
31
-
32
-
33
-
34
-
35
-
36
-
37
-
38
-
 39
39 -
 40
40 -
 41
41 -
 42
42 -
 43
43 -
 44
44 -
 45
45 -
 46
46 -
 47
47 -
 48
48 -
 49
49 -
 50
50 -
 51
51 -
 52
52 -
 53
53 -
 54
54 -
 55
55 -
 56
56 -
 57
57 -
 58
58 -
 59
59 -
60
-
61
-
62
-
63
-
64
-
65
-
66
-
67
-
68
-
69
-
70
-
71
-
72
-
73
-
74
-
75
-
76
-
77
-
78
-
79
-
80
-
81
-
82
-
83
-
84
-
85
-
86
-
87
-
88
-
89
-
90
-
91
-
92
-
93
-
94
-
95
-
96
-
97
-
98
-
99
-
100
-
101
-
102
-
103
-
104
-
105
-
106
-
107
-
108
-
109
-
110
-
111
-
112
 |
 |

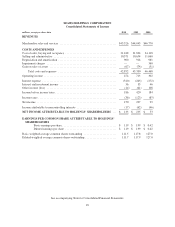
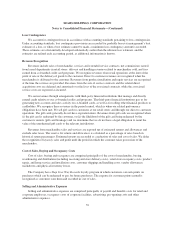
SEARS HOLDINGS CORPORATION
Consolidated Statements of Income
millions, except per share data 2010 2009 2008
REVENUES
Merchandise sales and services ........................................ $43,326 $44,043 $46,770
COSTS AND EXPENSES
Cost of sales, buying and occupancy .................................... 31,448 31,824 34,118
Selling and administrative ............................................ 10,571 10,654 11,060
Depreciation and amortization ......................................... 900 926 981
Impairment charges ................................................. — — 360
Gain on sales of assets ............................................... (67) (74) (51)
Total costs and expenses ......................................... 42,852 43,330 46,468
Operating income ................................................... 474 713 302
Interest expense .................................................... (310) (265) (272)
Interest and investment income ........................................ 36 33 46
Other income (loss) ................................................. (14) (61) 108
Income before income taxes ........................................... 186 420 184
Income taxes ....................................................... (36) (123) (85)
Net income ........................................................ 150 297 99
Income attributable to noncontrolling interests ............................ (17) (62) (46)
NET INCOME ATTRIBUTABLE TO HOLDINGS’ SHAREHOLDERS . . . $ 133 $ 235 $ 53
EARNINGS PER COMMON SHARE ATTRIBUTABLE TO HOLDINGS’
SHAREHOLDERS
Basic earnings per share ...................................... $ 1.19 $ 1.99 $ 0.42
Diluted earnings per share .................................... $ 1.19 $ 1.99 $ 0.42
Basic weighted average common shares outstanding ....................... 111.5 117.8 127.0
Diluted weighted average common shares outstanding ...................... 111.7 117.9 127.0
See accompanying Notes to Consolidated Financial Statements.
49