Sears 2010 Annual Report Download - page 27
Download and view the complete annual report
Please find page 27 of the 2010 Sears annual report below. You can navigate through the pages in the report by either clicking on the pages listed below, or by using the keyword search tool below to find specific information within the annual report.-
 1
1 -
2
-
3
-
4
-
5
-
6
-
7
-
8
-
9
-
10
-
11
-
12
-
13
-
14
-
15
-
16
-
 17
17 -
 18
18 -
 19
19 -
 20
20 -
 21
21 -
 22
22 -
 23
23 -
 24
24 -
 25
25 -
 26
26 -
 27
27 -
 28
28 -
 29
29 -
 30
30 -
 31
31 -
 32
32 -
 33
33 -
 34
34 -
 35
35 -
 36
36 -
 37
37 -
38
-
39
-
40
-
41
-
42
-
43
-
44
-
45
-
46
-
47
-
48
-
49
-
50
-
51
-
52
-
53
-
54
-
55
-
56
-
57
-
58
-
59
-
60
-
61
-
62
-
63
-
64
-
65
-
66
-
67
-
68
-
69
-
70
-
71
-
72
-
73
-
74
-
75
-
76
-
77
-
78
-
79
-
80
-
81
-
82
-
83
-
84
-
85
-
86
-
87
-
88
-
89
-
90
-
91
-
92
-
93
-
94
-
95
-
96
-
97
-
98
-
99
-
100
-
101
-
102
-
103
-
104
-
105
-
106
-
107
-
108
-
109
-
110
-
111
-
112
 |
 |
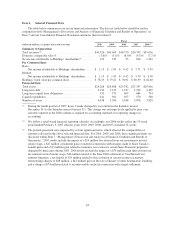
Operating Income
Operating income was $713 million for 2009 and $302 million for 2008. Operating income increased $411
million and was the result of reductions in selling and administrative expenses, partially offset by lower gross
margin dollars given lower overall sales. Operating income for 2009 includes expenses of $301 million related to
domestic pension plans, store closings and severance, a $44 million gain recognized by Sears Canada on the sale
of its former headquarters, and a $32 million gain recorded in connection with the settlement of Visa/MasterCard
antitrust litigation. Operating income for 2008 included a charge of $437 million related to costs associated with
asset impairments and store closings and severance, as well as the positive impact of the reversal of a $62 million
reserve because of a favorable verdict in connection with a legal settlement.
Interest Expense
We incurred $265 million in interest expense during 2009 and $272 million in 2008. While our total debt
balances declined throughout the year, our interest expense was flat to 2008 primarily due to an increase in
amortization expense related to capitalized debt issuance costs related to our amended revolving credit facility.
Interest and Investment Income
We earned $33 million in interest and investment income in 2009 and $46 million for 2008. Interest and
investment income includes dividends of $9 million and $10 million in 2009 and 2008, respectively, from our
cost method investment in Sears Mexico, and interest income of $5 million and $25 million in 2009 and 2008,
respectively. The decrease in interest income in 2009 was primarily due to lower yields received on short-term
investments during the year, as well as lower average cash balances throughout the year.
Other Income (Loss)
Other income (loss) is primarily comprised of mark-to-market and settlement gains and losses on Sears
Canada hedge transactions. Total net mark-to-market and settlement losses of $67 million were recorded on these
transactions in 2009. Total net gains of $81 million were recorded on these transactions in 2008. See Notes 4 and
5 to the Consolidated Financial Statements for further information regarding these transactions.
Income Taxes
Our effective tax rate was 29.3% in 2009 and 46.2% in 2008. The decrease in our tax rate is primarily due to
the resolution of certain federal and state income tax matters during 2009, which resulted in the recording of a
$41 million tax benefit. Income tax expense in 2008 included a benefit of $8 million related to the resolution of
certain tax matters, but was higher mainly due to a portion of our impairment charge for goodwill in 2008 not
being deductible for tax purposes.
27