Sears 2010 Annual Report Download - page 76
Download and view the complete annual report
Please find page 76 of the 2010 Sears annual report below. You can navigate through the pages in the report by either clicking on the pages listed below, or by using the keyword search tool below to find specific information within the annual report.-
 1
1 -
2
-
3
-
4
-
5
-
6
-
7
-
8
-
9
-
10
-
11
-
12
-
13
-
14
-
15
-
16
-
17
-
18
-
19
-
20
-
21
-
22
-
23
-
24
-
25
-
26
-
27
-
28
-
29
-
30
-
31
-
32
-
33
-
34
-
35
-
36
-
37
-
38
-
39
-
40
-
41
-
42
-
43
-
44
-
45
-
46
-
47
-
48
-
49
-
50
-
51
-
52
-
53
-
54
-
55
-
56
-
57
-
58
-
59
-
60
-
61
-
62
-
63
-
64
-
65
-
 66
66 -
 67
67 -
 68
68 -
 69
69 -
 70
70 -
 71
71 -
 72
72 -
 73
73 -
 74
74 -
 75
75 -
 76
76 -
 77
77 -
 78
78 -
 79
79 -
 80
80 -
 81
81 -
 82
82 -
 83
83 -
 84
84 -
 85
85 -
 86
86 -
87
-
88
-
89
-
90
-
91
-
92
-
93
-
94
-
95
-
96
-
97
-
98
-
99
-
100
-
101
-
102
-
103
-
104
-
105
-
106
-
107
-
108
-
109
-
110
-
111
-
112
 |
 |

SEARS HOLDINGS CORPORATION
Notes to Consolidated Financial Statements—(Continued)
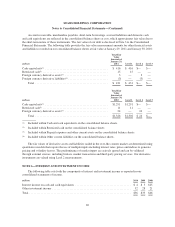
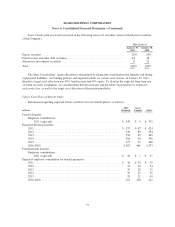
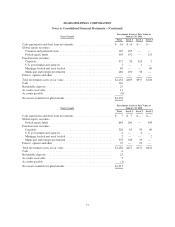
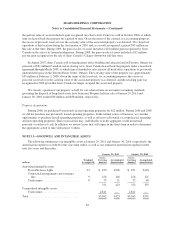
Fair Value of Pension and Postretirement Benefit Plan Assets
The following table presents our plan assets using the fair value hierarchy described in Note 5 at January 29,
2011 and January 30, 2010:
SHC Domestic
Investment Assets at Fair Value at
January 29, 2011
Total Level 1 Level 2 Level 3
Cash equivalents and short term investments ......................... $ 248 $ — $ 248 $—
Global equity securities
Common and preferred stock .................................... 1,416 1,416 — —
Registered investment companies ................................ 1 1 — —
Fixed income securities
Corporate ................................................... 1,952 — 1,952 —
Sears Holdings Corporation senior secured notes .................... 240 — 240 —
U.S. government and agencies ................................... 15 — 15 —
Mortgage backed and asset backed ............................... 32 — 31 1
Municipal and foreign government ............................... 58 — 58 —
Ventures and partnerships ........................................ 21 — 1 20
Total investment assets at fair value ................................ $3,983 $1,417 $2,545 $ 21
Cash ......................................................... 60
Accounts receivable ............................................. 47
Accounts payable ............................................... (36)
Net assets available for plan benefits ................................ $4,054
SHC Domestic
Investment Assets at Fair Value at
January 30, 2010
Total Level 1 Level 2 Level 3
Cash equivalents and short term investments ......................... $ 157 $ — $ 157 $—
Global equity securities
Common and preferred stock .................................... 1,263 1,262 1 —
Registered investment companies ................................ 5 5 — —
Fixed income securities
Corporate ................................................... 1,205 — 1,205 —
U.S. government and agencies ................................... 301 — 301 —
Mortgage backed and asset backed ............................... 377 — 364 13
Municipal and foreign government ............................... 73 — 73 —
Ventures and partnerships ........................................ 50 — 1 49
Total investment assets at fair value ................................ $3,431 $1,267 $2,102 $ 62
Cash ......................................................... 172
Accounts receivable ............................................. 59
Accounts payable ............................................... (29)
Net assets available for plan benefits ................................ $3,633
76