Sears 2010 Annual Report Download - page 90
Download and view the complete annual report
Please find page 90 of the 2010 Sears annual report below. You can navigate through the pages in the report by either clicking on the pages listed below, or by using the keyword search tool below to find specific information within the annual report.-
 1
1 -
2
-
3
-
4
-
5
-
6
-
7
-
8
-
9
-
10
-
11
-
12
-
13
-
14
-
15
-
16
-
17
-
18
-
19
-
20
-
21
-
22
-
23
-
24
-
25
-
26
-
27
-
28
-
29
-
30
-
31
-
32
-
33
-
34
-
35
-
36
-
37
-
38
-
39
-
40
-
41
-
42
-
43
-
44
-
45
-
46
-
47
-
48
-
49
-
50
-
51
-
52
-
53
-
54
-
55
-
56
-
57
-
58
-
59
-
60
-
61
-
62
-
63
-
64
-
65
-
66
-
67
-
68
-
69
-
70
-
71
-
72
-
73
-
74
-
75
-
76
-
77
-
78
-
79
-
 80
80 -
 81
81 -
 82
82 -
 83
83 -
 84
84 -
 85
85 -
 86
86 -
 87
87 -
 88
88 -
 89
89 -
 90
90 -
 91
91 -
 92
92 -
 93
93 -
 94
94 -
 95
95 -
 96
96 -
 97
97 -
 98
98 -
 99
99 -
 100
100 -
101
-
102
-
103
-
104
-
105
-
106
-
107
-
108
-
109
-
110
-
111
-
112
 |
 |

SEARS HOLDINGS CORPORATION
Notes to Consolidated Financial Statements—(Continued)
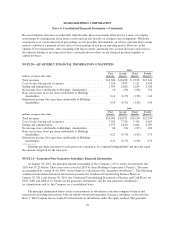
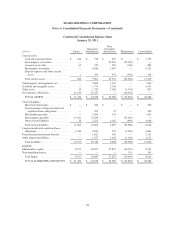
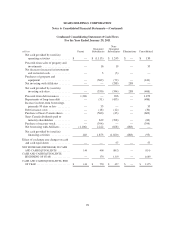
NOTE 18—SUMMARY OF SEGMENT DATA
These reportable segment classifications are based on our business formats, as described in Note 1. The
Kmart and Sears Canada formats represent both an operating and reportable segment. The Sears Domestic
reportable segment consists of the aggregation of several business formats. These formats are evaluated by our
Chief Operating Decision Maker to make decisions about resource allocation and to assess performance. Each of
these segments derives its revenues from the sale of merchandise and related services to customers, primarily in
the United States and Canada.
2010
millions Kmart
Sears
Domestic
Sears
Canada
Sears
Holdings
Merchandise sales and services ................................. $15,593 $22,937 $4,796 $43,326
Costs and expenses
Cost of sales, buying and occupancy ........................ 11,757 16,358 3,333 31,448
Selling and administrative ................................. 3,341 6,086 1,144 10,571
Depreciation and amortization ............................. 149 651 100 900
Gain on sales of assets .................................... (7) (46) (14) (67)
Total costs and expenses .............................. 15,240 23,049 4,563 42,852
Operating income (loss) ...................................... $ 353 $ (112) $ 233 $ 474
Total assets ................................................ $ 6,085 $15,207 $2,976 $24,268
Capital expenditures ......................................... $ 153 $ 231 $ 57 $ 441
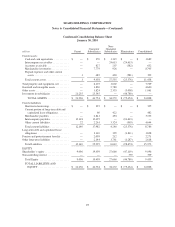
2009
millions Kmart
Sears
Domestic
Sears
Canada
Sears
Holdings
Merchandise sales and services ................................. $15,743 $23,672 $4,628 $44,043
Costs and expenses
Cost of sales, buying and occupancy ........................ 12,038 16,653 3,133 31,824
Selling and administrative ................................. 3,386 6,220 1,048 10,654
Depreciation and amortization ............................. 152 672 102 926
Gain on sales of assets .................................... (23) (6) (45) (74)
Total costs and expenses .............................. 15,553 23,539 4,238 43,330
Operating income ........................................... $ 190 $ 133 $ 390 $ 713
Total assets ................................................ $ 5,729 $15,489 $3,590 $24,808
Capital expenditures ......................................... $ 94 $ 212 $ 55 $ 361
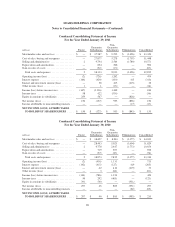
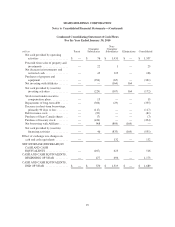
2008
millions Kmart
Sears
Domestic
Sears
Canada
Sears
Holdings
Merchandise sales and services ................................. $16,219 $25,315 $5,236 $46,770
Costs and expenses
Cost of sales, buying and occupancy ........................ 12,442 18,084 3,592 34,118
Selling and administrative ................................. 3,456 6,415 1,189 11,060
Depreciation and amortization ............................. 138 724 119 981
Impairment charges ...................................... 21 339 — 360
Gain on sales of assets .................................... (10) (10) (31) (51)
Total costs and expenses .............................. 16,047 25,552 4,869 46,468
Operating income (loss) ...................................... $ 172 $ (237) $ 367 $ 302
Total assets ................................................ $ 5,968 $16,089 $3,285 $25,342
Capital expenditures ......................................... $ 183 $ 223 $ 91 $ 497
90