Sears 2010 Annual Report Download - page 23
Download and view the complete annual report
Please find page 23 of the 2010 Sears annual report below. You can navigate through the pages in the report by either clicking on the pages listed below, or by using the keyword search tool below to find specific information within the annual report.-
 1
1 -
2
-
3
-
4
-
5
-
6
-
7
-
8
-
9
-
10
-
11
-
12
-
 13
13 -
 14
14 -
 15
15 -
 16
16 -
 17
17 -
 18
18 -
 19
19 -
 20
20 -
 21
21 -
 22
22 -
 23
23 -
 24
24 -
 25
25 -
 26
26 -
 27
27 -
 28
28 -
 29
29 -
 30
30 -
 31
31 -
 32
32 -
 33
33 -
34
-
35
-
36
-
37
-
38
-
39
-
40
-
41
-
42
-
43
-
44
-
45
-
46
-
47
-
48
-
49
-
50
-
51
-
52
-
53
-
54
-
55
-
56
-
57
-
58
-
59
-
60
-
61
-
62
-
63
-
64
-
65
-
66
-
67
-
68
-
69
-
70
-
71
-
72
-
73
-
74
-
75
-
76
-
77
-
78
-
79
-
80
-
81
-
82
-
83
-
84
-
85
-
86
-
87
-
88
-
89
-
90
-
91
-
92
-
93
-
94
-
95
-
96
-
97
-
98
-
99
-
100
-
101
-
102
-
103
-
104
-
105
-
106
-
107
-
108
-
109
-
110
-
111
-
112
 |
 |

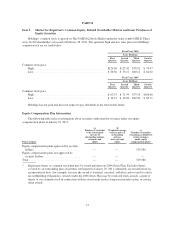
Fiscal 2008 (Year ended January 31, 2009)
millions, except per share data GAAP Impairments
Mark-to-
Market
Gains
Closed Store
Reserve and
Severance
Legal
Settlement
Repurchase
of Debt
Securities
Tax
Matters
As
Adjusted
Cost of sales, buying and
occupancy impact ........ $34,118 $ — $ — $ (36) $ — $ — $ — $34,082
Selling and administrative
impact ................. 11,060 — — (41) 62 — — 11,081
Impairment charges impact . . . 360 (360) — — — — — —
Operating income impact .... 302 360 — 77 (62) — — 677
Interest expense impact ...... (272) — — — — (13) — (285)
Other income impact ........ 108 — (81) — — — — 27
Income tax expense impact . . . (85) (107) 26 (30) 25 5 (8) (174)
Noncontrolling interest
impact ................. (46) (52) 22 — — — — (76)
After tax and noncontrolling
interest impact ........... 53 201 (33) 47 (37) (8) (8) 215
Diluted income per share
impact ................. $ 0.42 $1.57 $(0.26) $0.37 $(0.29) $(0.06) $(0.06) $ 1.69
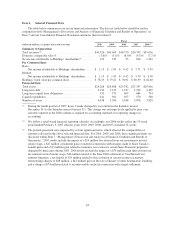
Contributions to our pension plans remain a significant use of our cash on an annual basis. While Sears
Holdings’ pension plan is frozen, and thus associates do not currently earn pension benefits, we have a legacy
pension obligation for past service performed by Kmart and Sears, Roebuck and Co. associates. The annual
pension expense included in our financial statements related to these legacy domestic pension plans was
relatively minimal in years prior to 2009. However, due to the severe decline in the capital markets that occurred
in the latter part of 2008, our domestic pension expense was $120 million in 2010 and $170 million in 2009.
During 2010, Sears Canada paid $754 million in dividends of which Holdings received $639 million. As
Sears Canada is a consolidated subsidiary of Holdings, no income was recognized on the receipt of the
dividend. However, Holdings did record $9 million of income tax expense related to the dividend.
Revenues and Comparable Store Sales
Revenues declined $717 million, or 1.6%, to $43 billion, in 2010 from $44 billion in 2009. The decrease was
primarily due to lower comparable store sales and the impact of having fewer Kmart and Sears full-line stores in
operation during 2010. Revenues included a $433 million increase due to foreign currency exchange rates.
Domestic comparable store sales declined 1.6% in the aggregate, with an increase at Kmart of 0.7% and a
decline at Sears Domestic of 3.6% in 2010. The Kmart improvement was driven by increases in most categories,
with higher increases in the apparel, footwear, jewelry, sporting goods and toys categories, partially offset by
declines in the food and consumables and pharmacy categories. Declines in sales at Sears Domestic were
primarily driven by the hardlines categories, as well as apparel. Over half of the total decline occurred in the
consumer electronics category. In contrast, Sears’ footwear, jewelry and automotive categories generated
comparable store sales growth during the period.
Gross Margin
We generated $11.9 billion in gross margin in 2010 and $12.2 billion in 2009. Current year gross margin
dollars include an increase of $142 million related to the impact of foreign currency exchange rates and charges
of $12 million for markdowns recorded in connection with store closings announced during 2010. Gross margin
for 2009 included a $37 million charge for markdowns recorded in connection with store closings. Gross margin
declined $341 million as compared to the prior year, primarily due to declines in sales and margin rate at Sears
Domestic and Sears Canada, partially offset by an increase in gross margin and margin rate at Kmart.
23