Sears 2010 Annual Report Download - page 21
Download and view the complete annual report
Please find page 21 of the 2010 Sears annual report below. You can navigate through the pages in the report by either clicking on the pages listed below, or by using the keyword search tool below to find specific information within the annual report.-
 1
1 -
2
-
3
-
4
-
5
-
6
-
7
-
8
-
9
-
10
-
 11
11 -
 12
12 -
 13
13 -
 14
14 -
 15
15 -
 16
16 -
 17
17 -
 18
18 -
 19
19 -
 20
20 -
 21
21 -
 22
22 -
 23
23 -
 24
24 -
 25
25 -
 26
26 -
 27
27 -
 28
28 -
 29
29 -
 30
30 -
 31
31 -
32
-
33
-
34
-
35
-
36
-
37
-
38
-
39
-
40
-
41
-
42
-
43
-
44
-
45
-
46
-
47
-
48
-
49
-
50
-
51
-
52
-
53
-
54
-
55
-
56
-
57
-
58
-
59
-
60
-
61
-
62
-
63
-
64
-
65
-
66
-
67
-
68
-
69
-
70
-
71
-
72
-
73
-
74
-
75
-
76
-
77
-
78
-
79
-
80
-
81
-
82
-
83
-
84
-
85
-
86
-
87
-
88
-
89
-
90
-
91
-
92
-
93
-
94
-
95
-
96
-
97
-
98
-
99
-
100
-
101
-
102
-
103
-
104
-
105
-
106
-
107
-
108
-
109
-
110
-
111
-
112
 |
 |

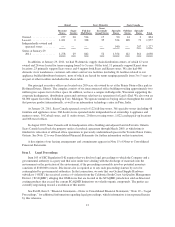
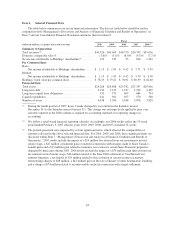
Holdings’ Consolidated Results
Holdings’ consolidated results of operations for 2010, 2009, and 2008 are summarized as follows:
millions, except per share data 2010 2009 2008
REVENUES
Merchandise sales and services ........................................ $43,326 $44,043 $46,770
COSTS AND EXPENSES
Cost of sales, buying and occupancy .................................... 31,448 31,824 34,118
Gross margin dollars ................................................ 11,878 12,219 12,652
Margin rate ....................................................... 27.4% 27.7% 27.1%
Selling and administrative ............................................ 10,571 10,654 11,060
Selling and administrative expense as a percentage of revenues .............. 24.4% 24.2% 23.6%
Depreciation and amortization ......................................... 900 926 981
Impairment charges ................................................. — — 360
Gain on sales of assets ............................................... (67) (74) (51)
Total costs and expenses ......................................... 42,852 43,330 46,468
Operating income ................................................... 474 713 302
Interest expense .................................................... (310) (265) (272)
Interest and investment income ........................................ 36 33 46
Other income (loss) ................................................. (14) (61) 108
Income before income taxes ........................................... 186 420 184
Income taxes ....................................................... (36) (123) (85)
Net income ........................................................ 150 297 99
Income attributable to noncontrolling interests ............................ (17) (62) (46)
NET INCOME ATTRIBUTABLE TO HOLDINGS’ SHAREHOLDERS . . . $ 133 $ 235 $ 53
EARNINGS PER COMMON SHARE ATTRIBUTABLE TO HOLDINGS’
SHAREHOLDERS
Diluted earnings per share ............................................ $ 1.19 $ 1.99 $ 0.42
Diluted weighted average common shares outstanding ...................... 111.7 117.9 127.0
References to comparable store sales amounts within the following discussion include sales for all stores
operating for a period of at least 12 full months, including remodeled and expanded stores, but excluding store
relocations and stores that have undergone format changes. Comparable store sales results for 2010 were
calculated based on the 52-week period ended January 29, 2011.
2010 Compared to 2009
Net Income Attributable to Holdings’ Shareholders
We recorded net income attributable to Holdings’ shareholders of $133 million ($1.19 per diluted share) for
2010 and $235 million ($1.99 per diluted share) in 2009. Our results for 2010 and 2009 were affected by a
number of significant items. Our net income, as adjusted for these significant items was $231 million ($2.07 per
diluted share) for 2010 and $376 million ($3.19 per diluted share) for 2009. The decrease in net income for the
year reflects a decrease in operating income of $239 million, primarily due to a decline in gross margin, due to
lower overall revenues, partially offset by a decline in selling and administrative expenses.
In addition to net income determined in accordance with GAAP, we use certain non-GAAP measures in
assessing our operating performance. We believe GAAP measures “As Adjusted” serve as appropriate measures
to be used in evaluating the performance of our business and we adjust incentive compensation metrics for our
21