Sears 2010 Annual Report Download - page 75
Download and view the complete annual report
Please find page 75 of the 2010 Sears annual report below. You can navigate through the pages in the report by either clicking on the pages listed below, or by using the keyword search tool below to find specific information within the annual report.-
 1
1 -
2
-
3
-
4
-
5
-
6
-
7
-
8
-
9
-
10
-
11
-
12
-
13
-
14
-
15
-
16
-
17
-
18
-
19
-
20
-
21
-
22
-
23
-
24
-
25
-
26
-
27
-
28
-
29
-
30
-
31
-
32
-
33
-
34
-
35
-
36
-
37
-
38
-
39
-
40
-
41
-
42
-
43
-
44
-
45
-
46
-
47
-
48
-
49
-
50
-
51
-
52
-
53
-
54
-
55
-
56
-
57
-
58
-
59
-
60
-
61
-
62
-
63
-
64
-
 65
65 -
 66
66 -
 67
67 -
 68
68 -
 69
69 -
 70
70 -
 71
71 -
 72
72 -
 73
73 -
 74
74 -
 75
75 -
 76
76 -
 77
77 -
 78
78 -
 79
79 -
 80
80 -
 81
81 -
 82
82 -
 83
83 -
 84
84 -
 85
85 -
86
-
87
-
88
-
89
-
90
-
91
-
92
-
93
-
94
-
95
-
96
-
97
-
98
-
99
-
100
-
101
-
102
-
103
-
104
-
105
-
106
-
107
-
108
-
109
-
110
-
111
-
112
 |
 |

SEARS HOLDINGS CORPORATION
Notes to Consolidated Financial Statements—(Continued)
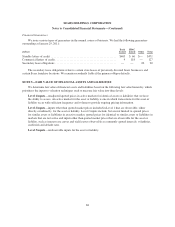
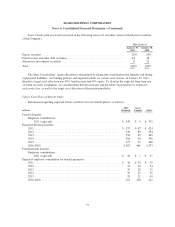
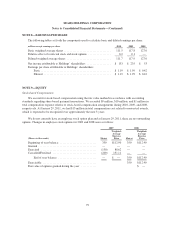
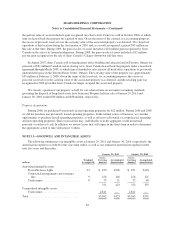
Sears Canada plan assets were invested in the following classes of securities (none of which were securities
of the Company):
Plan Assets at
January 29,
2011
January 30,
2010
Equity securities ......................................................... 28% 20%
Fixed income and other debt securities ........................................ 64 48
Alternative investments securities ........................................... 8 32
Total .................................................................. 100% 100%
The Sears Canada plans’ target allocation is determined by taking into consideration the amounts and timing
of projected liabilities, our funding policies and expected returns on various asset classes. At January 29, 2011,
the plan’s target asset allocation was 60% fixed income and 40% equity. To develop the expected long-term rate
of return on assets assumption, we considered the historical returns and the future expectations for returns for
each asset class, as well as the target asset allocation of the pension portfolio.
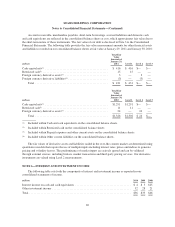
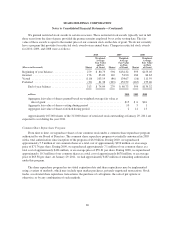
Future Cash Flows of Benefit Plans
Information regarding expected future cash flows for our benefit plans is as follows:
millions
SHC
Domestic
Sears
Canada Total
Pension benefits:
Employer contributions:
2011 (expected) .............................................. $ 343 $ 9 $ 352
Expected benefit payments:
2011 ........................................................... $ 337 $ 87 $ 424
2012 ........................................................... 346 88 434
2013 ........................................................... 356 89 445
2014 ........................................................... 366 90 456
2015 ........................................................... 377 91 468
2016-2020 ...................................................... 2,007 466 2,473
Postretirement benefits:
Employer contributions:
2011 (expected) .............................................. $ 36 $ 1 $ 37
Expected employer contribution for benefit payments:
2011 ........................................................... $ 36 $ 19 $ 55
2012 ........................................................... 34 20 54
2013 ........................................................... 32 20 52
2014 ........................................................... 30 21 51
2015 ........................................................... 28 21 49
2016-2020 ...................................................... 114 108 222
75