Sears 2010 Annual Report Download - page 68
Download and view the complete annual report
Please find page 68 of the 2010 Sears annual report below. You can navigate through the pages in the report by either clicking on the pages listed below, or by using the keyword search tool below to find specific information within the annual report.-
 1
1 -
2
-
3
-
4
-
5
-
6
-
7
-
8
-
9
-
10
-
11
-
12
-
13
-
14
-
15
-
16
-
17
-
18
-
19
-
20
-
21
-
22
-
23
-
24
-
25
-
26
-
27
-
28
-
29
-
30
-
31
-
32
-
33
-
34
-
35
-
36
-
37
-
38
-
39
-
40
-
41
-
42
-
43
-
44
-
45
-
46
-
47
-
48
-
49
-
50
-
51
-
52
-
53
-
54
-
55
-
56
-
57
-
 58
58 -
 59
59 -
 60
60 -
 61
61 -
 62
62 -
 63
63 -
 64
64 -
 65
65 -
 66
66 -
 67
67 -
 68
68 -
 69
69 -
 70
70 -
 71
71 -
 72
72 -
 73
73 -
 74
74 -
 75
75 -
 76
76 -
 77
77 -
 78
78 -
79
-
80
-
81
-
82
-
83
-
84
-
85
-
86
-
87
-
88
-
89
-
90
-
91
-
92
-
93
-
94
-
95
-
96
-
97
-
98
-
99
-
100
-
101
-
102
-
103
-
104
-
105
-
106
-
107
-
108
-
109
-
110
-
111
-
112
 |
 |

SEARS HOLDINGS CORPORATION
Notes to Consolidated Financial Statements—(Continued)
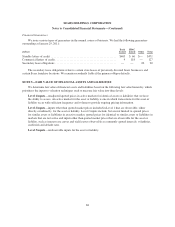
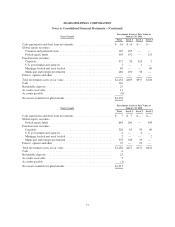
Financial Guarantees
We issue various types of guarantees in the normal course of business. We had the following guarantees
outstanding at January 29, 2011:
millions
Bank
Issued
SRAC
Issued Other Total
Standby letters of credit .............................................. $405 $ 66 $— $471
Commercial letters of credit ........................................... 9 118 — 127
Secondary lease obligations ........................................... — — 20 20
The secondary lease obligations relate to certain store leases of previously divested Sears businesses and
certain Sears franchise locations. We remain secondarily liable if the primary obligor defaults.
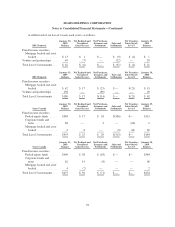
NOTE 5—FAIR VALUE OF FINANCIAL ASSETS AND LIABILITIES
We determine fair value of financial assets and liabilities based on the following fair value hierarchy, which
prioritizes the inputs to valuation techniques used to measure fair value into three levels:
Level 1 inputs—unadjusted quoted prices in active markets for identical assets or liabilities that we have
the ability to access. An active market for the asset or liability is one in which transactions for the asset or
liability occur with sufficient frequency and volume to provide ongoing pricing information.
Level 2 inputs—inputs other than quoted market prices included in Level 1 that are observable, either
directly or indirectly, for the asset or liability. Level 2 inputs include, but are not limited to, quoted prices
for similar assets or liabilities in an active market, quoted prices for identical or similar assets or liabilities in
markets that are not active and inputs other than quoted market prices that are observable for the asset or
liability, such as interest rate curves and yield curves observable at commonly quoted intervals, volatilities,
credit risk and default rates.
Level 3 inputs—unobservable inputs for the asset or liability.
68