Sears 2010 Annual Report Download - page 33
Download and view the complete annual report
Please find page 33 of the 2010 Sears annual report below. You can navigate through the pages in the report by either clicking on the pages listed below, or by using the keyword search tool below to find specific information within the annual report.-
 1
1 -
2
-
3
-
4
-
5
-
6
-
7
-
8
-
9
-
10
-
11
-
12
-
13
-
14
-
15
-
16
-
17
-
18
-
19
-
20
-
21
-
22
-
 23
23 -
 24
24 -
 25
25 -
 26
26 -
 27
27 -
 28
28 -
 29
29 -
 30
30 -
 31
31 -
 32
32 -
 33
33 -
 34
34 -
 35
35 -
 36
36 -
 37
37 -
 38
38 -
 39
39 -
 40
40 -
 41
41 -
 42
42 -
 43
43 -
44
-
45
-
46
-
47
-
48
-
49
-
50
-
51
-
52
-
53
-
54
-
55
-
56
-
57
-
58
-
59
-
60
-
61
-
62
-
63
-
64
-
65
-
66
-
67
-
68
-
69
-
70
-
71
-
72
-
73
-
74
-
75
-
76
-
77
-
78
-
79
-
80
-
81
-
82
-
83
-
84
-
85
-
86
-
87
-
88
-
89
-
90
-
91
-
92
-
93
-
94
-
95
-
96
-
97
-
98
-
99
-
100
-
101
-
102
-
103
-
104
-
105
-
106
-
107
-
108
-
109
-
110
-
111
-
112
 |
 |

Sears Canada
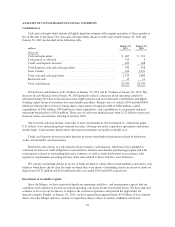
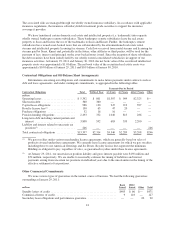
Sears Canada, a consolidated, 92%-owned subsidiary of Sears, conducts similar retail operations as Sears
Domestic. Sears Canada results and key statistics were as follows:
millions, except for number of stores 2010 2009 2008
Merchandise sales and services ........................................... $4,796 $4,628 $5,236
Cost of sales, buying and occupancy ....................................... 3,333 3,133 3,592
Gross margin dollars ................................................... 1,463 1,495 1,644
Margin rate .......................................................... 30.5% 32.3% 31.4%
Selling and administrative ............................................... 1,144 1,048 1,189
Selling and administrative expense as a percentage of revenues ................. 23.9% 22.6% 22.7%
Depreciation and amortization ............................................ 100 102 119
Gain on sales of assets .................................................. (14) (45) (31)
Total costs and expenses ............................................ 4,563 4,238 4,869
Operating income ...................................................... $ 233 $ 390 $ 367
Number of:
Full-line stores .................................................... 122 122 122
Specialty stores .................................................... 361 280 266
Total Sears Canada stores ............................................... 483 402 388
2010 Compared to 2009
Revenues
Sears Canada’s revenues increased 3.6% in 2010. The increase in total revenues of $168 million includes a
$433 million increase due to the impact of exchange rates. On a Canadian dollar basis, revenues decreased by
$265 million, primarily reflecting a comparable store sales decrease of 4.0%. Comparable store sales decreases
were more pronounced in the appliances and apparel categories. We believe the decline in comparable store sales
is mainly the result of a continued tightening in consumer discretionary spending resulting from falling consumer
confidence levels, as well as increased cross-border shopping due to the effect of a strong Canadian dollar
relative to the U.S. dollar.
Gross Margin
Gross margin dollars decreased $32 million to $1.5 billion for 2010 and include a $142 million increase due
to the impact of exchange rates. Gross margin decreased $174 million on a Canadian dollar basis as a result of
lower overall sales and a decline in margin rate. Sears Canada’s margin rate decreased to 30.5% in 2010 from
32.3% in 2009 due to price compression in the appliance and electronics categories, as well as an increase in
promotional and clearance markdowns related to a challenging economic environment.
Selling and Administrative Expenses
Sears Canada’s selling and administrative expenses increased $96 million to $1.1 billion in 2010 and
includes a $97 million increase due to the impact of exchange rates. On a Canadian dollar basis, selling and
administrative expenses were flat. Sears Canada’s selling and administrative expense rate was 23.9% in 2010 and
22.6% in 2009, and increased primarily as a result of lower expense leverage given lower overall sales on a
Canadian dollar basis.
33