Sears 2010 Annual Report Download - page 77
Download and view the complete annual report
Please find page 77 of the 2010 Sears annual report below. You can navigate through the pages in the report by either clicking on the pages listed below, or by using the keyword search tool below to find specific information within the annual report.-
 1
1 -
2
-
3
-
4
-
5
-
6
-
7
-
8
-
9
-
10
-
11
-
12
-
13
-
14
-
15
-
16
-
17
-
18
-
19
-
20
-
21
-
22
-
23
-
24
-
25
-
26
-
27
-
28
-
29
-
30
-
31
-
32
-
33
-
34
-
35
-
36
-
37
-
38
-
39
-
40
-
41
-
42
-
43
-
44
-
45
-
46
-
47
-
48
-
49
-
50
-
51
-
52
-
53
-
54
-
55
-
56
-
57
-
58
-
59
-
60
-
61
-
62
-
63
-
64
-
65
-
66
-
 67
67 -
 68
68 -
 69
69 -
 70
70 -
 71
71 -
 72
72 -
 73
73 -
 74
74 -
 75
75 -
 76
76 -
 77
77 -
 78
78 -
 79
79 -
 80
80 -
 81
81 -
 82
82 -
 83
83 -
 84
84 -
 85
85 -
 86
86 -
 87
87 -
88
-
89
-
90
-
91
-
92
-
93
-
94
-
95
-
96
-
97
-
98
-
99
-
100
-
101
-
102
-
103
-
104
-
105
-
106
-
107
-
108
-
109
-
110
-
111
-
112
 |
 |

SEARS HOLDINGS CORPORATION
Notes to Consolidated Financial Statements—(Continued)
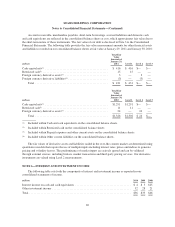
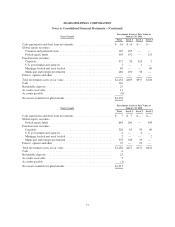
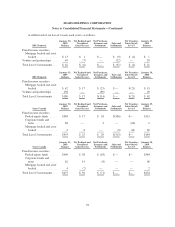
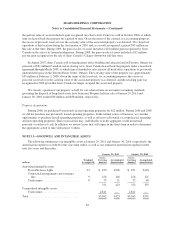
Sears Canada
Investment Assets at Fair Value at
January 29, 2011
Total Level 1 Level 2 Level 3
Cash equivalents and short term investments ........................... $ 16 $ 16 $— $—
Global equity securities
Common and preferred stock ..................................... 185 185 — —
Pooled equity funds ............................................ 305 192 — 113
Fixed income securities
Corporate .................................................... 372 50 320 2
U.S. government and agencies .................................... 1 — 1 —
Mortgage backed and asset backed ................................ 69 — — 69
Municipal and foreign government ................................ 286 250 36 —
Futures, options and other ......................................... — — — —
Total investment assets at fair value .................................. $1,234 $693 $357 $184
Cash .......................................................... 116
Refundable deposits .............................................. 25
Accounts receivable .............................................. 11
Accounts payable ................................................ (8)
Net assets available for plan benefits ................................. $1,378
Sears Canada
Investment Assets at Fair Value at
January 30, 2010
Total Level 1 Level 2 Level 3
Cash equivalents and short term investments ........................... $ 7 $ 7 $— $—
Global equity securities
Pooled equity funds ............................................ 644 260 — 384
Fixed income securities
Corporate .................................................... 226 65 93 68
U.S. government and agencies .................................... 2 — 2 —
Mortgage backed and asset backed ................................ 2 — — 2
Municipal and foreign government ................................ 378 345 33 —
Futures, options and other ......................................... 23 — 23 —
Total investment assets at fair value .................................. $1,282 $677 $151 $454
Cash .......................................................... 6
Refundable deposits .............................................. 23
Accounts receivable .............................................. 3
Accounts payable ................................................ (1)
Net assets available for plan benefits ................................. $1,313
77