Sears 2010 Annual Report Download - page 96
Download and view the complete annual report
Please find page 96 of the 2010 Sears annual report below. You can navigate through the pages in the report by either clicking on the pages listed below, or by using the keyword search tool below to find specific information within the annual report.-
 1
1 -
2
-
3
-
4
-
5
-
6
-
7
-
8
-
9
-
10
-
11
-
12
-
13
-
14
-
15
-
16
-
17
-
18
-
19
-
20
-
21
-
22
-
23
-
24
-
25
-
26
-
27
-
28
-
29
-
30
-
31
-
32
-
33
-
34
-
35
-
36
-
37
-
38
-
39
-
40
-
41
-
42
-
43
-
44
-
45
-
46
-
47
-
48
-
49
-
50
-
51
-
52
-
53
-
54
-
55
-
56
-
57
-
58
-
59
-
60
-
61
-
62
-
63
-
64
-
65
-
66
-
67
-
68
-
69
-
70
-
71
-
72
-
73
-
74
-
75
-
76
-
77
-
78
-
79
-
80
-
81
-
82
-
83
-
84
-
85
-
 86
86 -
 87
87 -
 88
88 -
 89
89 -
 90
90 -
 91
91 -
 92
92 -
 93
93 -
 94
94 -
 95
95 -
 96
96 -
 97
97 -
 98
98 -
 99
99 -
 100
100 -
 101
101 -
 102
102 -
 103
103 -
 104
104 -
 105
105 -
 106
106 -
107
-
108
-
109
-
110
-
111
-
112
 |
 |

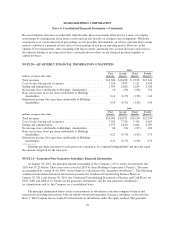
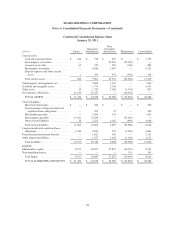
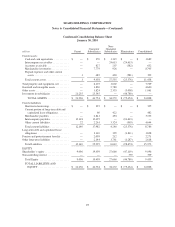
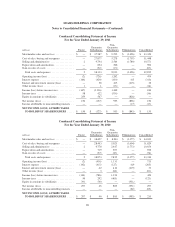
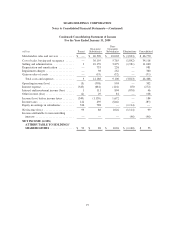
SEARS HOLDINGS CORPORATION
Notes to Consolidated Financial Statements—(Continued)
Condensed Consolidating Statement of Income
For the Year Ended January 29, 2011
millions Parent
Guarantor
Subsidiaries
Non-
Guarantor
Subsidiaries Eliminations Consolidated
Merchandise sales and services .............. $ — $ 37,587 $ 9,235 $ (3,496) $ 43,326
Cost of sales, buying and occupancy .......... — 27,877 5,278 (1,707) 31,448
Selling and administrative .................. 2 9,794 2,564 (1,789) 10,571
Depreciation and amortization ............... — 694 206 — 900
Gain on sales of assets ..................... — (52) (15) — (67)
Total costs and expenses ................. 2 38,313 8,033 (3,496) 42,852
Operating income (loss) .................... (2) (726) 1,202 — 474
Interest expense .......................... (166) (429) (130) 415 (310)
Interest and investment income (loss) ......... — 38 413 (415) 36
Other income (loss) ....................... 1 1 (16) — (14)
Income (loss) before income taxes ............ (167) (1,116) 1,469 — 186
Income taxes ............................ 58 422 (516) — (36)
Equity in earnings in subsidiaries ............ 259 567 — (826) —
Net income (loss) ......................... 150 (127) 953 (826) 150
Income attributable to noncontrolling interests . . — — — (17) (17)
NET INCOME (LOSS) ATTRIBUTABLE
TO HOLDINGS’ SHAREHOLDERS ..... $ 150 $ (127) $ 953 $ (843) $ 133
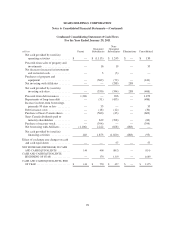
Condensed Consolidating Statement of Income
For the Year Ended January 30, 2010
millions Parent
Guarantor
Subsidiaries
Non-
Guarantor
Subsidiaries Eliminations Consolidated
Merchandise sales and services .............. $ — $ 38,457 $ 8,963 $ (3,377) $ 44,043
Cost of sales, buying and occupancy .......... — 28,403 5,025 (1,604) 31,824
Selling and administrative .................. 2 9,778 2,647 (1,773) 10,654
Depreciation and amortization ............... — 719 207 — 926
Gain on sales of assets ..................... — (27) (47) — (74)
Total costs and expenses ................. 2 38,873 7,832 (3,377) 43,330
Operating income (loss) .................... (2) (416) 1,131 — 713
Interest expense .......................... (142) (415) (127) 419 (265)
Interest and investment income (loss) ......... — 42 410 (419) 33
Other income (loss) ....................... — 3 (64) — (61)
Income (loss) before income taxes ............ (144) (786) 1,350 — 420
Income taxes ............................ 50 292 (465) — (123)
Equity in earnings in subsidiaries ............ 391 540 — (931) —
Net income (loss) ......................... 297 46 885 (931) 297
Income attributable to noncontrolling interests . . — — — (62) (62)
NET INCOME (LOSS) ATTRIBUTABLE
TO HOLDINGS’ SHAREHOLDERS ..... $ 297 $ 46 $ 885 $ (993) $ 235
96