Sears 2010 Annual Report Download - page 30
Download and view the complete annual report
Please find page 30 of the 2010 Sears annual report below. You can navigate through the pages in the report by either clicking on the pages listed below, or by using the keyword search tool below to find specific information within the annual report.-
 1
1 -
2
-
3
-
4
-
5
-
6
-
7
-
8
-
9
-
10
-
11
-
12
-
13
-
14
-
15
-
16
-
17
-
18
-
19
-
 20
20 -
 21
21 -
 22
22 -
 23
23 -
 24
24 -
 25
25 -
 26
26 -
 27
27 -
 28
28 -
 29
29 -
 30
30 -
 31
31 -
 32
32 -
 33
33 -
 34
34 -
 35
35 -
 36
36 -
 37
37 -
 38
38 -
 39
39 -
 40
40 -
41
-
42
-
43
-
44
-
45
-
46
-
47
-
48
-
49
-
50
-
51
-
52
-
53
-
54
-
55
-
56
-
57
-
58
-
59
-
60
-
61
-
62
-
63
-
64
-
65
-
66
-
67
-
68
-
69
-
70
-
71
-
72
-
73
-
74
-
75
-
76
-
77
-
78
-
79
-
80
-
81
-
82
-
83
-
84
-
85
-
86
-
87
-
88
-
89
-
90
-
91
-
92
-
93
-
94
-
95
-
96
-
97
-
98
-
99
-
100
-
101
-
102
-
103
-
104
-
105
-
106
-
107
-
108
-
109
-
110
-
111
-
112
 |
 |

Operating Income
Kmart recorded operating income of $190 million in 2009 and $172 million in 2008. Kmart’s operating
income for 2009 includes expenses of $65 million related to store closings and severance, partially offset by a
$17 million gain related to settlement of Visa/MasterCard antitrust litigation. Kmart’s operating income for 2008
includes expenses of $48 million related to impairment charges and store closings and severance.
Sears Domestic
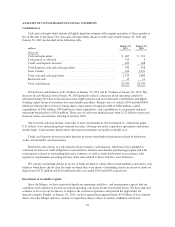
Sears Domestic results and key statistics were as follows:
millions, except for number of stores 2010 2009 2008
Merchandise sales and services ........................................ $22,937 $23,672 $25,315
Cost of sales, buying and occupancy .................................... 16,358 16,653 18,084
Gross margin dollars ................................................ 6,579 7,019 7,231
Margin rate ....................................................... 28.7% 29.7% 28.6%
Selling and administrative ............................................ 6,086 6,220 6,415
Selling and administrative expense as a percentage of revenues .............. 26.5% 26.3% 25.3%
Depreciation and amortization ......................................... 651 672 724
Impairment charges ................................................. — — 339
Gain on sales of assets ............................................... (46) (6) (10)
Total costs and expenses ......................................... 23,049 23,539 25,552
Operating income (loss) .............................................. $ (112) $ 133 $ (237)
Number of:
Full-line stores(1) ................................................ 894 908 929
Specialty stores ................................................. 1,354 1,284 1,233
Total Domestic Sears stores ........................................... 2,248 2,192 2,162
(1) 2010 includes 842 full-line stores and 52 Sears Essentials/Grand stores; 2009 includes 848 full-line stores
and 60 Sears Essentials/Grand stores; 2008 includes 856 full-line stores and 73 Sears Essentials/Grand
stores
2010 Compared to 2009
Revenues and Comparable Store Sales
Sears Domestic’s comparable store sales and total sales declined 3.6% and 3.1%, respectively, during 2010.
The decline in total revenues primarily reflects the impact of lower comparable store sales. Comparable store
sales declines were driven by the hardlines categories, as well as apparel. Over half of the total decline occurred
in consumer electronics. In contrast, Sears’ footwear, jewelry, and automotive categories generated comparable
store sales growth during the period.
Gross Margin
Sears Domestic’s gross margin dollars declined $440 million to $6.6 billion in 2010. Current year gross
margin included a $6 million charge recorded in cost of sales for margin related expenses taken in connection
with store closings. Sears Domestic’s gross margin for 2009 included a $10 million charge for markdowns
recorded in connection with store closings. The decline was mainly a result of the impact of lower overall sales
on Sears Domestic’s gross margin and a decline in margin rate. Sears Domestic’s gross margin rate was 28.7% in
2010 and 29.7% in 2009, a decrease of 100 basis points. The decline was mainly due to reduced margin rates in
home services and appliances.
30