Sears 2010 Annual Report Download - page 22
Download and view the complete annual report
Please find page 22 of the 2010 Sears annual report below. You can navigate through the pages in the report by either clicking on the pages listed below, or by using the keyword search tool below to find specific information within the annual report.-
 1
1 -
2
-
3
-
4
-
5
-
6
-
7
-
8
-
9
-
10
-
11
-
 12
12 -
 13
13 -
 14
14 -
 15
15 -
 16
16 -
 17
17 -
 18
18 -
 19
19 -
 20
20 -
 21
21 -
 22
22 -
 23
23 -
 24
24 -
 25
25 -
 26
26 -
 27
27 -
 28
28 -
 29
29 -
 30
30 -
 31
31 -
 32
32 -
33
-
34
-
35
-
36
-
37
-
38
-
39
-
40
-
41
-
42
-
43
-
44
-
45
-
46
-
47
-
48
-
49
-
50
-
51
-
52
-
53
-
54
-
55
-
56
-
57
-
58
-
59
-
60
-
61
-
62
-
63
-
64
-
65
-
66
-
67
-
68
-
69
-
70
-
71
-
72
-
73
-
74
-
75
-
76
-
77
-
78
-
79
-
80
-
81
-
82
-
83
-
84
-
85
-
86
-
87
-
88
-
89
-
90
-
91
-
92
-
93
-
94
-
95
-
96
-
97
-
98
-
99
-
100
-
101
-
102
-
103
-
104
-
105
-
106
-
107
-
108
-
109
-
110
-
111
-
112
 |
 |

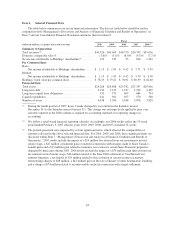
executive management team for these same items. Furthermore, we believe our use of GAAP measures “As
Adjusted,” including Diluted Income per Share “As Adjusted,” provides an appropriate measure to use in
assessing our performance across periods, given that this measure provides an adjustment for certain significant
items, the magnitude of which may vary significantly from period to period and, thereby, have a disproportionate
effect on the earnings we report for a given period. Accordingly, we consider the aggregate impact of these items,
along with reported results, in reviewing and evaluating our financial performance. However, we do not, and do
not recommend that you solely use GAAP measures “As Adjusted” to assess our financial performance or to
formulate investment decisions, as the measures may exclude a number of important cash and non-cash recurring
items. The following tables set forth results of operations on a GAAP and “As Adjusted” basis, as well as the
impact each significant item had on specific income and expense amounts reported in our Consolidated
Statements of Income during years 2010, 2009 and 2008.
Fiscal 2010 (Year ended January 29, 2011)
millions, except per share data GAAP
Domestic
Pension
Expense
Mark-to-
Market
Losses
Closed Store
Reserve and
Severance
Gain on Sale
of Real
Estate
Canadian
Dividend Tax
Impact
Tax
Matters
As
Adjusted
Cost of sales, buying and
occupancy impact ......... $31,448 $ — $ — $ (12) $ — $ — $ — $31,436
Selling and administrative
impact .................. 10,571 (120) — (14) — — — 10,437
Depreciation and amortization
impact .................. 900 — — (10) — — — 890
Gain on sales of assets
impact .................. (67) — — — 35 — — (32)
Operating income impact ..... 474 120 — 36 (35) — — 595
Other loss impact ........... (14) — 6 — — — — (8)
Income tax expense impact . . . (36) (24) (1) (6) 7 9 (13) (64)
Noncontrolling interest
impact .................. (17) — (1) — — — — (18)
After tax and noncontrolling
interest impact ........... 133 96 4 30 (28) 9 (13) 231
Diluted income per share
impact .................. $ 1.19 $0.86 $0.04 $0.27 $(0.25) $0.08 $(0.12) $ 2.07
Fiscal 2009 (Year ended January 30, 2010)
millions, except per share data GAAP
Domestic
Pension
Expense
Mark-to-
Market
Gains
Closed Store
Reserve and
Severance
Gain on Sale
of Sears
Canada
Headquarters
Visa /
MasterCard
Settlement
Tax
Matters
As
Adjusted
Cost of sales, buying and
occupancy impact ......... $31,824 $ — $ — $ (37) $ — $ — $ — $31,787
Selling and administrative
impact .................. 10,654 (170) — (82) — 32 — 10,434
Depreciation and amortization
impact .................. 926 — — (12) — — — 914
Gain on sales of assets
impact .................. (74) — — — 44 — — (30)
Operating income impact ..... 713 170 — 131 (44) (32) — 938
Other loss impact ........... (61) — 33 — — — — (28)
Income tax expense impact . . . (123) (50) (8) (38) 10 10 (41) (240)
Noncontrolling interest
impact .................. (62) — (9) (3) 12 — — (62)
After tax and noncontrolling
interest impact ........... 235 120 16 90 (22) (22) (41) 376
Diluted income per share
impact .................. $ 1.99 $1.02 $0.14 $0.77 $(0.19) $(0.19) $(0.35) $ 3.19
22