Sears 2010 Annual Report Download - page 97
Download and view the complete annual report
Please find page 97 of the 2010 Sears annual report below. You can navigate through the pages in the report by either clicking on the pages listed below, or by using the keyword search tool below to find specific information within the annual report.-
 1
1 -
2
-
3
-
4
-
5
-
6
-
7
-
8
-
9
-
10
-
11
-
12
-
13
-
14
-
15
-
16
-
17
-
18
-
19
-
20
-
21
-
22
-
23
-
24
-
25
-
26
-
27
-
28
-
29
-
30
-
31
-
32
-
33
-
34
-
35
-
36
-
37
-
38
-
39
-
40
-
41
-
42
-
43
-
44
-
45
-
46
-
47
-
48
-
49
-
50
-
51
-
52
-
53
-
54
-
55
-
56
-
57
-
58
-
59
-
60
-
61
-
62
-
63
-
64
-
65
-
66
-
67
-
68
-
69
-
70
-
71
-
72
-
73
-
74
-
75
-
76
-
77
-
78
-
79
-
80
-
81
-
82
-
83
-
84
-
85
-
86
-
 87
87 -
 88
88 -
 89
89 -
 90
90 -
 91
91 -
 92
92 -
 93
93 -
 94
94 -
 95
95 -
 96
96 -
 97
97 -
 98
98 -
 99
99 -
 100
100 -
 101
101 -
 102
102 -
 103
103 -
 104
104 -
 105
105 -
 106
106 -
 107
107 -
108
-
109
-
110
-
111
-
112
 |
 |

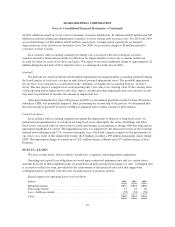
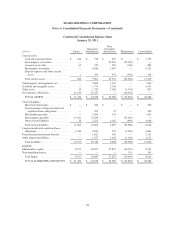
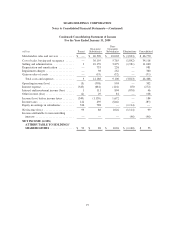
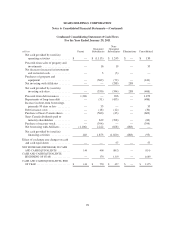
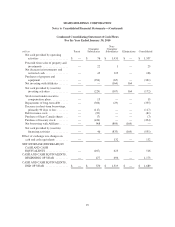
SEARS HOLDINGS CORPORATION
Notes to Consolidated Financial Statements—(Continued)
Condensed Consolidating Statement of Income
For the Year Ended January 31, 2009
millions Parent
Guarantor
Subsidiaries
Non-
Guarantor
Subsidiaries Eliminations Consolidated
Merchandise sales and services .......... $ — $ 40,590 $ 10,003 $ (3,823) $ 46,770
Cost of sales, buying and occupancy ...... — 30,195 5,765 (1,842) 34,118
Selling and administrative .............. 3 10,159 2,879 (1,981) 11,060
Depreciation and amortization ........... — 755 226 — 981
Impairment charges .................... — 98 262 — 360
Gain on sales of assets ................. — (19) (32) — (51)
Total costs and expenses .............. 3 41,188 9,100 (3,823) 46,468
Operating income (loss) ................ (3) (598) 903 — 302
Interest expense ....................... (345) (681) (116) 870 (272)
Interest and investment income (loss) ..... 1 111 804 (870) 46
Other income (loss) .................... (2) 29 81 — 108
Income (loss) before income taxes ........ (349) (1,139) 1,672 — 184
Income taxes ......................... 122 439 (646) — (85)
Equity in earnings in subsidiaries ......... 326 788 — (1,114) —
Net income (loss) ..................... 99 88 1,026 (1,114) 99
Income attributable to noncontrolling
interests ........................... — — — (46) (46)
NET INCOME (LOSS)
ATTRIBUTABLE TO HOLDINGS’
SHAREHOLDERS ................. $ 99 $ 88 $ 1,026 $ (1,160) $ 53
97