Sears 2010 Annual Report Download - page 69
Download and view the complete annual report
Please find page 69 of the 2010 Sears annual report below. You can navigate through the pages in the report by either clicking on the pages listed below, or by using the keyword search tool below to find specific information within the annual report.-
 1
1 -
2
-
3
-
4
-
5
-
6
-
7
-
8
-
9
-
10
-
11
-
12
-
13
-
14
-
15
-
16
-
17
-
18
-
19
-
20
-
21
-
22
-
23
-
24
-
25
-
26
-
27
-
28
-
29
-
30
-
31
-
32
-
33
-
34
-
35
-
36
-
37
-
38
-
39
-
40
-
41
-
42
-
43
-
44
-
45
-
46
-
47
-
48
-
49
-
50
-
51
-
52
-
53
-
54
-
55
-
56
-
57
-
58
-
 59
59 -
 60
60 -
 61
61 -
 62
62 -
 63
63 -
 64
64 -
 65
65 -
 66
66 -
 67
67 -
 68
68 -
 69
69 -
 70
70 -
 71
71 -
 72
72 -
 73
73 -
 74
74 -
 75
75 -
 76
76 -
 77
77 -
 78
78 -
 79
79 -
80
-
81
-
82
-
83
-
84
-
85
-
86
-
87
-
88
-
89
-
90
-
91
-
92
-
93
-
94
-
95
-
96
-
97
-
98
-
99
-
100
-
101
-
102
-
103
-
104
-
105
-
106
-
107
-
108
-
109
-
110
-
111
-
112
 |
 |

SEARS HOLDINGS CORPORATION
Notes to Consolidated Financial Statements—(Continued)
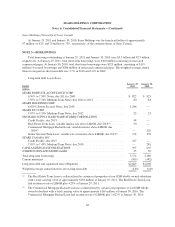
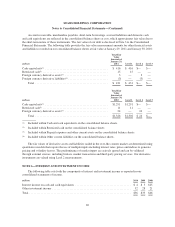
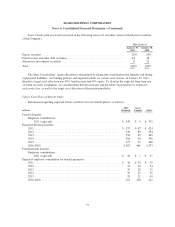
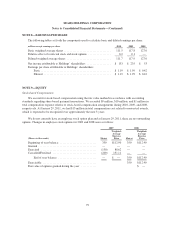
Accounts receivable, merchandise payables, short-term borrowings, accrued liabilities and domestic cash
and cash equivalents are reflected in the consolidated balance sheets at cost, which approximates fair value due to
the short-term nature of these instruments. The fair value of our debt is disclosed in Note 3 to the Consolidated
Financial Statements. The following table provides the fair value measurement amounts for other financial assets
and liabilities recorded on our consolidated balance sheets at fair value at January 29, 2011 and January 30, 2010:
millions
Total Fair
Value
Amounts at
January 29,
2011 Level 1 Level 2 Level 3
Cash equivalents(1) ............................................ $ 416 $ 416 $— $—
Restricted cash(2) .............................................. 15 15 — —
Foreign currency derivative assets(3) .............................. 3 — 3 —
Foreign currency derivative liabilities(4) ............................ (3) — (3) —
Total ................................................... $ 431 $ 431 $— $—
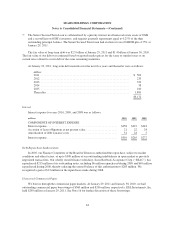
millions
Total Fair
Value
Amounts at
January 30,
2010 Level 1 Level 2 Level 3
Cash equivalents(1) ............................................ $1,291 $1,291 $— $—
Restricted cash(2) .............................................. 11 11 — —
Foreign currency derivative assets(3) .............................. 24 — 24 —
Total ................................................... $1,326 $1,302 $ 24 $—
(1) Included within Cash and cash equivalents on the consolidated balance sheets.
(2) Included within Restricted cash on the consolidated balance sheets.
(3) Included within Prepaid expenses and other current assets on the consolidated balance sheets.
(4) Included within Other current liabilities on the consolidated balance sheets.
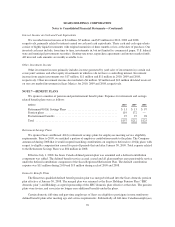
The fair values of derivative assets and liabilities traded in the over-the-counter market are determined using
quantitative models that require the use of multiple inputs including interest rates, prices and indices to generate
pricing and volatility factors. The predominance of market inputs are actively quoted and can be validated
through external sources, including brokers, market transactions and third-party pricing services. Our derivative
instruments are valued using Level 2 measurements.
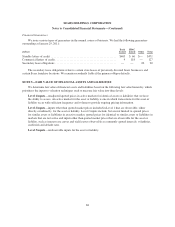
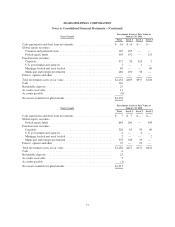
NOTE 6—INTEREST AND INVESTMENT INCOME
The following table sets forth the components of interest and investment income as reported in our
consolidated statements of income.
millions 2010 2009 2008
Interest income on cash and cash equivalents ....................................... $ 4 $ 5 $25
Other investment income ....................................................... 32 28 21
Total ....................................................................... $36 $33 $46
69