Sears 2010 Annual Report Download - page 25
Download and view the complete annual report
Please find page 25 of the 2010 Sears annual report below. You can navigate through the pages in the report by either clicking on the pages listed below, or by using the keyword search tool below to find specific information within the annual report.-
 1
1 -
2
-
3
-
4
-
5
-
6
-
7
-
8
-
9
-
10
-
11
-
12
-
13
-
14
-
 15
15 -
 16
16 -
 17
17 -
 18
18 -
 19
19 -
 20
20 -
 21
21 -
 22
22 -
 23
23 -
 24
24 -
 25
25 -
 26
26 -
 27
27 -
 28
28 -
 29
29 -
 30
30 -
 31
31 -
 32
32 -
 33
33 -
 34
34 -
 35
35 -
36
-
37
-
38
-
39
-
40
-
41
-
42
-
43
-
44
-
45
-
46
-
47
-
48
-
49
-
50
-
51
-
52
-
53
-
54
-
55
-
56
-
57
-
58
-
59
-
60
-
61
-
62
-
63
-
64
-
65
-
66
-
67
-
68
-
69
-
70
-
71
-
72
-
73
-
74
-
75
-
76
-
77
-
78
-
79
-
80
-
81
-
82
-
83
-
84
-
85
-
86
-
87
-
88
-
89
-
90
-
91
-
92
-
93
-
94
-
95
-
96
-
97
-
98
-
99
-
100
-
101
-
102
-
103
-
104
-
105
-
106
-
107
-
108
-
109
-
110
-
111
-
112
 |
 |
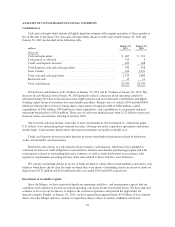
Operating Income
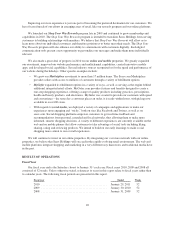
Operating income was $474 million for 2010 and $713 million for 2009. Operating income decreased $239
million and was the result of reductions in gross margin, partially offset by lower selling and administrative
expenses. Operating income for 2010 includes expenses of $156 million related to domestic pension plans, store
closings and severance and a $35 million gain recognized on the sale of a Sears Auto Center. Operating income
for 2009 includes expenses of $301 million related to domestic pension plans, store closings and severance, a $44
million gain recognized by Sears Canada on the sale of its former headquarters, and a $32 million gain recorded
in connection with the settlement of Visa/MasterCard antitrust litigation.
Interest Expense
We incurred $310 million in interest expense during 2010 and $265 million in 2009. Our interest expense
increased primarily due to an increase in average total debt balances throughout 2010.
Other Income (Loss)
Other income (loss) is primarily comprised of mark-to-market and settlement gains and losses on Sears
Canada hedge transactions. Total net mark-to-market and settlement losses of $15 million were recorded on these
transactions in 2010. Total net mark-to-market and settlement losses of $67 million were recorded on these
transactions in 2009. See Notes 4 and 5 to the Consolidated Financial Statements for further information
regarding these transactions.
Income Taxes
Our effective tax rate was 19.4% in 2010 and 29.3% in 2009. The decrease in our tax rate is primarily due to
lower taxable income and the resolution of certain federal and state income tax matters during 2010, which
resulted in a $13 million tax benefit.
2009 Compared to 2008
Net Income Attributable to Holdings’ Shareholders
We recorded net income attributable to Holdings’ shareholders of $235 million ($1.99 per diluted share) for
2009 and $53 million ($0.42 per diluted share) in 2008. Our results for 2009 and 2008 were affected by a number
of significant items. Our net income, as adjusted for these significant items was $376 million ($3.19 per diluted
share) for 2009 and $215 million ($1.69 per diluted share) for 2008. The increase in net income for the year
reflects an increase in operating income of $411 million, primarily due to a decline in selling and administrative
expenses and the below noted significant items, partially offset by a decline in gross margin dollars.
Revenues and Comparable Store Sales
Revenues declined $2.8 billion, or 5.8%, to $44 billion, in 2009 from $46.8 billion in 2008. The decrease
was primarily due to lower comparable store sales and the impact of having 62 fewer Kmart and Sears full-line
stores in operation during 2009, and includes a $142 million decline due to foreign currency exchange rates.
Domestic comparable store sales declined 5.1% in the aggregate, and included a modest decline at Kmart of
0.8% and a decline at Sears Domestic of 8.7% in 2009. The decline in comparable store sales at Kmart was
primarily driven by lower sales in the apparel and food and consumables categories, partially offset by increases
in the toys category, as well as the benefit of assuming the operations of its footwear business from a third party
effective January 2009. Declines in sales at Sears Domestic reflect decreases in the home appliance, lawn &
garden, and home electronics categories.
25