Sears 2006 Annual Report Download - page 84
Download and view the complete annual report
Please find page 84 of the 2006 Sears annual report below. You can navigate through the pages in the report by either clicking on the pages listed below, or by using the keyword search tool below to find specific information within the annual report.-
 1
1 -
2
-
3
-
4
-
5
-
6
-
7
-
8
-
9
-
10
-
11
-
12
-
13
-
14
-
15
-
16
-
17
-
18
-
19
-
20
-
21
-
22
-
23
-
24
-
25
-
26
-
27
-
28
-
29
-
30
-
31
-
32
-
33
-
34
-
35
-
36
-
37
-
38
-
39
-
40
-
41
-
42
-
43
-
44
-
45
-
46
-
47
-
48
-
49
-
50
-
51
-
52
-
53
-
54
-
55
-
56
-
57
-
58
-
59
-
60
-
61
-
62
-
63
-
64
-
65
-
66
-
67
-
68
-
69
-
70
-
71
-
72
-
73
-
 74
74 -
 75
75 -
 76
76 -
 77
77 -
 78
78 -
 79
79 -
 80
80 -
 81
81 -
 82
82 -
 83
83 -
 84
84 -
 85
85 -
 86
86 -
 87
87 -
 88
88 -
 89
89 -
 90
90 -
 91
91 -
 92
92 -
 93
93 -
 94
94 -
95
-
96
-
97
-
98
-
99
-
100
-
101
-
102
-
103
-
104
-
105
-
106
-
107
-
108
-
109
-
110
-
111
-
112
 |
 |

SEARS HOLDINGS CORPORATION
Notes to Consolidated Financial Statements—(Continued)
Unrecognized net gains in accumulated other comprehensive income are not expected to be amortized as a
component of net periodic benefit cost during fiscal 2007.
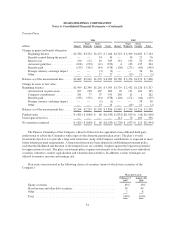
Information regarding expected future cash flows for the Company’s benefit plans is as follows:
millions Kmart
Sears
Domestic
Sears
Canada Total
Pension benefits:
Employer contributions:
Fiscal 2007 (expected) ................................... $ 47 $ 146 $— $ 193
Expected benefit payments:
Fiscal 2007 ................................................ $145 $ 220 $ 67 $ 432
Fiscal 2008 ................................................ 148 205 68 421
Fiscal 2009 ................................................ 153 195 69 417
Fiscal 2010 ................................................ 157 199 70 426
Fiscal 2011 ................................................ 162 204 71 437
Fiscal 2012-2016 ........................................... 893 1,050 379 2,322
Postretirement benefits:
Employer contributions:
Fiscal 2007 (expected) ................................... $— $ 43 $ 15 $ 58
Expected benefit payments:
Fiscal 2007 ................................................ $— $ 43 $ 15 $ 58
Fiscal 2008 ................................................ — 42 16 58
Fiscal 2009 ................................................ — 40 17 57
Fiscal 2010 ................................................ — 38 18 56
Fiscal 2011 ................................................ — 36 18 54
Fiscal 2012-2016 ........................................... — 153 96 249
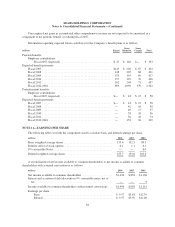
NOTE 11—EARNINGS PER SHARE
The following tables set forth the components used to calculate basic and diluted earnings per share.
millions 2006 2005 2004
Basic weighted average shares .................................. 155.6 152.5 89.3
Dilutive effect of stock options ................................. 0.1 1.1 6.1
9% convertible Notes ......................................... — — 6.0
Diluted weighted average shares ................................ 155.7 153.6 101.4
A reconciliation of net income available to common shareholders to net income available to common
shareholders with assumed conversions is as follows:
millions 2006 2005 2004
Net income available to common shareholders ..................... $1,490 $ 858 $1,106
Interest and accretion of debt discount on 9% convertible notes, net of
tax ...................................................... — — 9
Income available to common shareholders with assumed conversions . . . $1,490 $ 858 $1,115
Earnings per share
Basic .................................................. $ 9.57 $5.63 $12.39
Diluted ................................................ $ 9.57 $5.59 $11.00
84