Sears 2006 Annual Report Download - page 34
Download and view the complete annual report
Please find page 34 of the 2006 Sears annual report below. You can navigate through the pages in the report by either clicking on the pages listed below, or by using the keyword search tool below to find specific information within the annual report.-
 1
1 -
2
-
3
-
4
-
5
-
6
-
7
-
8
-
9
-
10
-
11
-
12
-
13
-
14
-
15
-
16
-
17
-
18
-
19
-
20
-
21
-
22
-
23
-
 24
24 -
 25
25 -
 26
26 -
 27
27 -
 28
28 -
 29
29 -
 30
30 -
 31
31 -
 32
32 -
 33
33 -
 34
34 -
 35
35 -
 36
36 -
 37
37 -
 38
38 -
 39
39 -
 40
40 -
 41
41 -
 42
42 -
 43
43 -
 44
44 -
45
-
46
-
47
-
48
-
49
-
50
-
51
-
52
-
53
-
54
-
55
-
56
-
57
-
58
-
59
-
60
-
61
-
62
-
63
-
64
-
65
-
66
-
67
-
68
-
69
-
70
-
71
-
72
-
73
-
74
-
75
-
76
-
77
-
78
-
79
-
80
-
81
-
82
-
83
-
84
-
85
-
86
-
87
-
88
-
89
-
90
-
91
-
92
-
93
-
94
-
95
-
96
-
97
-
98
-
99
-
100
-
101
-
102
-
103
-
104
-
105
-
106
-
107
-
108
-
109
-
110
-
111
-
112
 |
 |

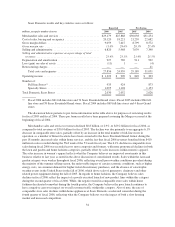
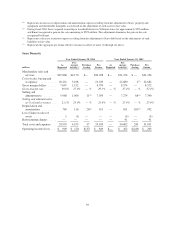
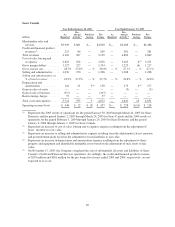
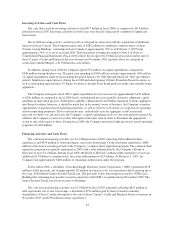
Sears Domestic results and key statistics were as follows:
Reported Pro Forma
millions, except for number of stores 2006 2005 2005 2004
Merchandise sales and services ............................ $29,179 $25,868 $30,038 $31,254
Cost of sales, buying and occupancy ........................ 20,120 18,221 21,239 22,682
Gross margin dollars .................................... 9,059 7,647 8,799 8,572
Gross margin rate ...................................... 31.0% 29.6% 29.3% 27.4%
Selling and administrative ................................ 6,820 5,968 7,039 7,340
Selling and administrative expenses as a percentage of total
revenues ............................................ 23.4% 23.1% 23.4% 23.5%
Depreciation and amortization ............................. 927 769 911 992
Loss (gain) on sales of assets .............................. (11) 1 — (4)
Restructuring charges .................................... — — — 41
Total costs and expenses ............................. 27,856 24,959 29,189 31,051
Operating income ....................................... $ 1,323 $ 909 $ 849 $ 203
Number of:
Full-line Stores(1) ................................... 935 924 873
Specialty Stores .................................... 1,095 1,128 1,153
Total Domestic Sears Stores .............................. 2,030 2,052 2,026
(1) Fiscal 2006 includes 861 full-line store and 74 Sears Essentials/Grand stores; Fiscal 2005 includes 866 full-
line store and 58 Sears Essentials/Grand stores; Fiscal 2004 includes 869 full-line stores and 4 Sears Grand
stores
The discussion below pertains to pro forma information in the table above for purposes of reviewing results
for fiscal 2005 and fiscal 2004. These pro forma results have been prepared assuming the Merger occurred at the
beginning of fiscal 2004.
Merchandise sales and services revenues declined $0.8 billion, or 2.9%, to $29.2 billion for fiscal 2006, as
compared to total revenues of $30.0 billion for fiscal 2005. The decline was due primarily to an aggregate 6.1%
decrease in comparable store sales, partially offset by an increase in the total number of full-line stores in
operation, as a number of Kmart locations have been converted to the Sears Essentials/Grand format during the
past 18 months, increased sales within home services, and the fact that fiscal 2006 revenues benefited from $410
million in sales recorded during the 53rd week of the 53-week fiscal year. The 6.1% decline in comparable store
sales during fiscal 2006 was recorded across most categories and formats, with more pronounced declines in both
the lawn and garden and home fashions categories, partially offset by sales increases within women’s apparel.
The sales increase in women’s apparel reflects what the Company believes are improved assortments in this
business relative to last year, as noted in the above discussion of consolidated results. Sales within the lawn and
garden category were weaker throughout fiscal 2006, reflecting overall poor weather conditions prevalent during
the majority of the summer selling season, the unfavorable impact of certain economic conditions, such as higher
energy costs, on consumer demand for higher-ticket discretionary purchases, and the absence of catastrophic
weather events in the United States in the fall of 2006, which drove sales of generators, chainsaws and other
related power equipment during the fall of 2005. In regards to home fashions, the Company believes sales
declines in fiscal 2006 reflect the impact of a poorly executed launch of new product lines within this category
during the second quarter of fiscal 2006. While, the negative trend in comparable store sales within home
fashions decelerated somewhat during the fourth quarter, the Company believes the poor launch continues to
have a negative carryover impact on overall customer traffic within this category. Also of note, the rate of
comparable store sales declines within home appliances at Sears Domestic accelerated somewhat during the
fourth quarter of fiscal 2006, reflecting what the Company believes was the impact of both a slow housing
market and increased competition.
34