Sears 2006 Annual Report Download - page 25
Download and view the complete annual report
Please find page 25 of the 2006 Sears annual report below. You can navigate through the pages in the report by either clicking on the pages listed below, or by using the keyword search tool below to find specific information within the annual report.-
 1
1 -
2
-
3
-
4
-
5
-
6
-
7
-
8
-
9
-
10
-
11
-
12
-
13
-
14
-
 15
15 -
 16
16 -
 17
17 -
 18
18 -
 19
19 -
 20
20 -
 21
21 -
 22
22 -
 23
23 -
 24
24 -
 25
25 -
 26
26 -
 27
27 -
 28
28 -
 29
29 -
 30
30 -
 31
31 -
 32
32 -
 33
33 -
 34
34 -
 35
35 -
36
-
37
-
38
-
39
-
40
-
41
-
42
-
43
-
44
-
45
-
46
-
47
-
48
-
49
-
50
-
51
-
52
-
53
-
54
-
55
-
56
-
57
-
58
-
59
-
60
-
61
-
62
-
63
-
64
-
65
-
66
-
67
-
68
-
69
-
70
-
71
-
72
-
73
-
74
-
75
-
76
-
77
-
78
-
79
-
80
-
81
-
82
-
83
-
84
-
85
-
86
-
87
-
88
-
89
-
90
-
91
-
92
-
93
-
94
-
95
-
96
-
97
-
98
-
99
-
100
-
101
-
102
-
103
-
104
-
105
-
106
-
107
-
108
-
109
-
110
-
111
-
112
 |
 |

Net Income
For fiscal 2006, net income was $1.5 billion compared with net income of $858 million (reported) and $789
million (pro forma) in fiscal 2005. Net income for fiscal 2005 included an after-tax charge of $90 million
(reported and proforma) for the cumulative effect of a change in accounting as described above. The increase in
net income for the year reflects increased operating income at both Sears Domestic and Kmart, driven primarily
by improved margin rate performance, most notably within apparel during the second half of fiscal 2006, as well
as improved expense management across all segments. The favorable impact of these items more than offset the
negative impact of sales declines in fiscal 2006 relative to pro forma sales levels for fiscal 2005.
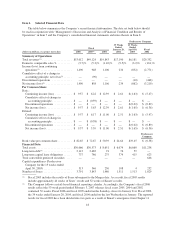
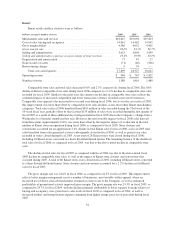
Earnings per Diluted Share and Significant Items
The table below sets forth earnings per share results for the Company’s most recent three fiscal years,
reflected on both a reported and pro forma basis for fiscal 2005 and fiscal 2004 as explained above. Net income
and earnings per diluted share results for all three fiscal years were impacted by certain significant items. The
magnitude of such items may vary significantly from period to period and, thereby, have a disproportionate effect
on earnings for any given period, affecting the comparability of the Company’s financial performance.
Accordingly, management considers the aggregate impact of these items, along with reported results, in
reviewing and evaluating the Company’s financial performance.
The impact of these items on diluted earnings per share is shown in the following table:
Reported Pro Forma
2006 2005 2004 2005 2004
Earnings per diluted share .................................. $9.57 $ 5.59 $11.00 $ 4.85 $ 5.40
Less:
Total return swap income .............................. 0.29 — — — —
Income tax settlements ................................ 0.20 — — — —
Visa/MasterCard settlement ............................ 0.14 — — — —
Legal reserve—AIG Annuity Insurance Co., et al. v. Sears
Roebuck ......................................... (0.29) — — — —
Gain on sale of assets ................................. 0.32 0.16 5.78 0.15 1.35
Restructuring charges ................................. (0.09) (0.35) — (0.33) (0.16)
Cumulative effect of change in accounting ................ — (0.58) — (0.55) —
Earnings per diluted share excluding the above items ........ $9.00 $ 6.36 $ 5.22 $ 5.58 $ 4.21
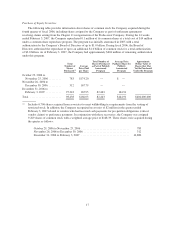
For fiscal 2006, net income included the following significant items: 1) pre-tax gains of $74 million ($45
million after-tax or $0.29 per diluted share) derived from the Company’s investment of a portion of its surplus
cash (see the “Interest and Investment Income” section below for further details); 2) a tax benefit of $31 million
($0.20 per diluted share) related to the resolution of certain income tax matters; 3) a $36 million pre-tax gain
($22 million after-tax or $0.14 per diluted share) recorded by the Company for the aggregate amount received by
Holdings in June 2006 as part of the settlement of Visa/MasterCard antitrust litigation; and, 4) a pre-tax charge of
$74 million ($45 million after-tax or $0.29 per diluted share) related to an unfavorable verdict in connection with
a pre-Merger legal matter concerning Sears’ redemption of certain bonds in 2004. See Note 20 of Notes to
Consolidated Financial Statements for further information regarding this matter.
All three fiscal years were impacted by gains recorded on the sale of Company assets. These pre-tax gains
amounted to $82 million ($50 million after-tax or $0.32 per diluted share) in fiscal 2006, $39 million ($25
million after-tax or $0.16 per diluted share) in fiscal 2005, and $946 million ($586 million after-tax or $5.78 per
diluted share) in fiscal 2004. The fiscal 2004 gain reflects Kmart’s completion of multiple sale and lease
assignment transactions, including significant transactions with The Home Depot, Inc. (“Home Depot”) and
25