Sears 2006 Annual Report Download - page 32
Download and view the complete annual report
Please find page 32 of the 2006 Sears annual report below. You can navigate through the pages in the report by either clicking on the pages listed below, or by using the keyword search tool below to find specific information within the annual report.-
 1
1 -
2
-
3
-
4
-
5
-
6
-
7
-
8
-
9
-
10
-
11
-
12
-
13
-
14
-
15
-
16
-
17
-
18
-
19
-
20
-
21
-
 22
22 -
 23
23 -
 24
24 -
 25
25 -
 26
26 -
 27
27 -
 28
28 -
 29
29 -
 30
30 -
 31
31 -
 32
32 -
 33
33 -
 34
34 -
 35
35 -
 36
36 -
 37
37 -
 38
38 -
 39
39 -
 40
40 -
 41
41 -
 42
42 -
43
-
44
-
45
-
46
-
47
-
48
-
49
-
50
-
51
-
52
-
53
-
54
-
55
-
56
-
57
-
58
-
59
-
60
-
61
-
62
-
63
-
64
-
65
-
66
-
67
-
68
-
69
-
70
-
71
-
72
-
73
-
74
-
75
-
76
-
77
-
78
-
79
-
80
-
81
-
82
-
83
-
84
-
85
-
86
-
87
-
88
-
89
-
90
-
91
-
92
-
93
-
94
-
95
-
96
-
97
-
98
-
99
-
100
-
101
-
102
-
103
-
104
-
105
-
106
-
107
-
108
-
109
-
110
-
111
-
112
 |
 |

Kmart
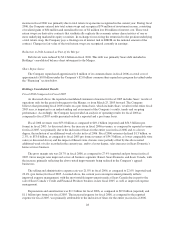
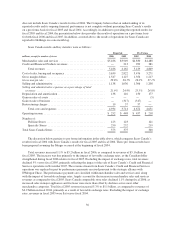
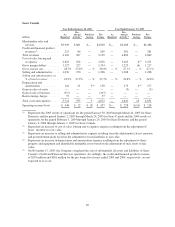
Kmart results and key statistics were as follows:
millions, except for number of stores 2006 2005 2004
Merchandise sales and services ...................................... $18,647 $19,094 $19,843
Cost of sales, buying and occupancy .................................. 14,061 14,462 14,942
Gross margin dollars .............................................. 4,586 4,632 4,901
Gross margin rate ................................................ 24.6% 24.3% 24.7%
Selling and administrative .......................................... 3,623 3,804 3,999
Selling and administrative expenses as a percentage of total revenues ....... 19.4% 19.9% 20.2%
Depreciation and amortization ...................................... 77 47 27
Gain on sales of assets ............................................. (71) (40) (946)
Restructuring charges ............................................. 9 54 —
Total costs and expenses ....................................... 17,699 18,327 18,022
Operating income ................................................ $ 948 $ 767 $ 1,821
Number of stores ................................................. 1,388 1,416 1,480
Comparable store sales and total sales decreased 0.6% and 2.3%, respectively, during fiscal 2006. The 0.6%
decline in Kmart comparable store sales during fiscal 2006 compares to a 1.2% decline in comparable store sales
recorded for fiscal 2005. Similar to the prior year, the current year decline in comparable store sales reflects the
continued impact of increased competition and lower transaction volumes recorded across most businesses.
Comparable store apparel sales increased for a second year during fiscal 2006, but as was the case in fiscal 2005,
this improvement was more than offset by comparable store sales declines across most other Kmart merchandise
categories. Total sales in fiscal 2006 benefited from $301 million in sales recorded during the 53rd week of the
53-week fiscal year, partially offset by the fact that $153 million of sales were recorded during the first quarter of
fiscal 2005 as a result of three additional days being included in fiscal 2005 due to the Company’s change from a
Wednesday to a Saturday month end last year. However, the net favorable impact on fiscal 2006 sales derived
from these items (approximately 0.8%) was more than offset by the negative impact of a reduction in the total
number of Kmart stores in operation during fiscal 2006, as compared to fiscal 2005. Store closures and
conversions accounted for an approximate 2.4% decline in total Kmart sales for fiscal 2006, as fiscal 2005 total
sales benefited from sales generated at stores subsequently closed in fiscal 2006, as well as partial-year sales
recorded in stores closed during fiscal 2005. A net total of 28 Kmart stores were closed during fiscal 2006,
including 16 Kmart stores converted to a Sears Essentials/Grand format. The remaining balance of the decline in
total sales for fiscal 2006, as compared to fiscal 2005, was due to the above-noted decline in comparable store
sales.
The decline in total sales for fiscal 2005 as compared with fiscal 2004 was due to the above-noted fiscal
2005 decline in comparable store sales, as well as the impact of Kmart store closures and conversions that
occurred during 2005. A total of 60 Kmart stores were closed in fiscal 2005, including 48 Kmart stores converted
to a Sears Essentials/Grand format. Store closures and conversions accounted for a 2.2% decline in total Kmart
sales for fiscal 2005.
The gross margin rate was 24.6% in fiscal 2006, as compared to 24.3% for fiscal 2005. This improvement
reflects better margin management across a number of businesses, most notably within apparel, where an
increased use of direct-sourced merchandise obtained at a lower cost to the Company, as well as enhanced
profitability of promotional activity improved gross margin. The gross margin rate was 24.3% in fiscal 2005, as
compared to 24.7% for fiscal 2004, with the decline primarily attributable to lower expense leverage relative to
buying and occupancy costs given lower sales levels in fiscal 2005 as compared to fiscal 2004, as well as
increased utilities and transportation expense stemming from higher energy price levels prevalent during fiscal
2005.
32