Sears 2006 Annual Report Download - page 39
Download and view the complete annual report
Please find page 39 of the 2006 Sears annual report below. You can navigate through the pages in the report by either clicking on the pages listed below, or by using the keyword search tool below to find specific information within the annual report.-
 1
1 -
2
-
3
-
4
-
5
-
6
-
7
-
8
-
9
-
10
-
11
-
12
-
13
-
14
-
15
-
16
-
17
-
18
-
19
-
20
-
21
-
22
-
23
-
24
-
25
-
26
-
27
-
28
-
 29
29 -
 30
30 -
 31
31 -
 32
32 -
 33
33 -
 34
34 -
 35
35 -
 36
36 -
 37
37 -
 38
38 -
 39
39 -
 40
40 -
 41
41 -
 42
42 -
 43
43 -
 44
44 -
 45
45 -
 46
46 -
 47
47 -
 48
48 -
 49
49 -
50
-
51
-
52
-
53
-
54
-
55
-
56
-
57
-
58
-
59
-
60
-
61
-
62
-
63
-
64
-
65
-
66
-
67
-
68
-
69
-
70
-
71
-
72
-
73
-
74
-
75
-
76
-
77
-
78
-
79
-
80
-
81
-
82
-
83
-
84
-
85
-
86
-
87
-
88
-
89
-
90
-
91
-
92
-
93
-
94
-
95
-
96
-
97
-
98
-
99
-
100
-
101
-
102
-
103
-
104
-
105
-
106
-
107
-
108
-
109
-
110
-
111
-
112
 |
 |

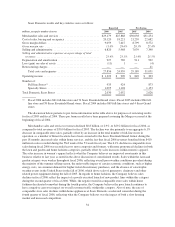
(4) Represents an increase in depreciation and amortization expense resulting from the adjustment to Sears’ property and
equipment and identifiable intangible assets based on the adjustment of such assets to fair value.
(5) During fiscal 2004, Sears acquired ownership or leasehold interest in 50 Kmart stores for approximately $576 million,
and Kmart recognized a gain on the sale amounting to $599 million. This adjustment eliminates the gain on the sale
recognized by Kmart.
(6) Represents a decrease to interest expense resulting from the adjustment to Sears debt based on the adjustments of such
liabilities to fair value.
(7) Represents the aggregate pro forma effective income tax effect of notes (2) through (6) above.
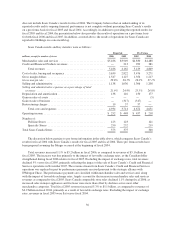
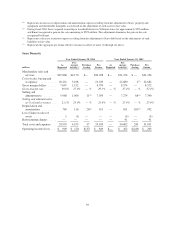
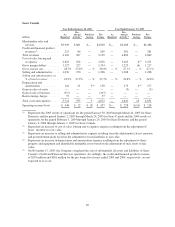
Sears Domestic
Year Ended January 28, 2006 Year Ended January 29, 2005
millions
As
Reported
Pre-
merger
Activity(1)
Purchase
Acctng
Pro
Forma
As
Reported
Pre-
merger
Activity(1)
Purchase
Acctng
Pro
Forma
Merchandise sales and
services .............. $25,868 $4,170 $— $30,038 $— $31,254 $ — $31,254
Cost of sales, buying and
occupancy ............ 18,221 3,018 — 21,239 — 22,680 2(2) 22,682
Gross margin dollars ...... 7,647 1,152 — 8,799 — 8,574 — 8,572
Gross margin rate ........ 29.6% 27.6% — % 29.3% — % 27.4% — % 27.4%
Selling and
administrative ......... 5,968 1,060 11(3) 7,039 — 7,274 66(3) 7,340
Selling and administrative
as % of total revenues ... 23.1% 25.4% — % 23.4% — % 27.4% — % 27.4%
Depreciation and
amortization ........... 769 116 26
(4) 911 — 811 181(4) 992
Loss (Gain) on sales of
assets ................ 1 (1) — — — (4) — (4)
Restructuring charges ..... — — — — — 41 — 41
Total costs and expenses . . . 24,959 4,193 37 29,189 — 30,802 249 31,051
Operating income (loss) .... $ 909 $ (23) $ (37) $ 849 $— $ 452 $(249) $ 203
39