Sears 2006 Annual Report Download - page 28
Download and view the complete annual report
Please find page 28 of the 2006 Sears annual report below. You can navigate through the pages in the report by either clicking on the pages listed below, or by using the keyword search tool below to find specific information within the annual report.-
 1
1 -
2
-
3
-
4
-
5
-
6
-
7
-
8
-
9
-
10
-
11
-
12
-
13
-
14
-
15
-
16
-
17
-
 18
18 -
 19
19 -
 20
20 -
 21
21 -
 22
22 -
 23
23 -
 24
24 -
 25
25 -
 26
26 -
 27
27 -
 28
28 -
 29
29 -
 30
30 -
 31
31 -
 32
32 -
 33
33 -
 34
34 -
 35
35 -
 36
36 -
 37
37 -
 38
38 -
39
-
40
-
41
-
42
-
43
-
44
-
45
-
46
-
47
-
48
-
49
-
50
-
51
-
52
-
53
-
54
-
55
-
56
-
57
-
58
-
59
-
60
-
61
-
62
-
63
-
64
-
65
-
66
-
67
-
68
-
69
-
70
-
71
-
72
-
73
-
74
-
75
-
76
-
77
-
78
-
79
-
80
-
81
-
82
-
83
-
84
-
85
-
86
-
87
-
88
-
89
-
90
-
91
-
92
-
93
-
94
-
95
-
96
-
97
-
98
-
99
-
100
-
101
-
102
-
103
-
104
-
105
-
106
-
107
-
108
-
109
-
110
-
111
-
112
 |
 |
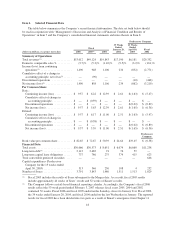
income in fiscal 2006 was primarily due to total return swap income recognized in the current year. During fiscal
2006, the Company entered into total return swaps and recognized $74 million of investment income, consisting
of realized gains of $84 million and unrealized losses of $2 million less $8 million of interest cost. These total
return swaps are derivative contracts that synthetically replicate the economic return characteristics of one or
more underlying marketable equity securities. In exchange for receiving the return tied to the position underlying
a total return swap, the Company pays a floating rate of interest tied to LIBOR on the notional amount of the
contract. Changes in fair value of the total return swaps are recognized currently in earnings.
Reduction in Debt Assumed as Part of the Merger
Debt levels were reduced by $0.4 billion in fiscal 2006. This debt was primarily Sears debt included in
Holdings’ consolidated balance sheet subsequent to the Merger.
Share Repurchases
The Company repurchased approximately 6 million of its common shares in fiscal 2006 at a total cost of
approximately $0.8 billion under the Company’s $2.0 billion common share repurchase program described under
the “Financing” section below.
Holdings Consolidated Results
Fiscal 2006 Compared to Fiscal 2005
As discussed above, the reported consolidated statement of income for fiscal 2005 includes Sears’ results of
operations only for the period subsequent to the Merger, or from March 25, 2005 forward. The Company
believes that presenting fiscal 2005 results on a pro forma basis, which includes Sears’ results for the entire fiscal
2005 year, is important to an understanding and assessment of the Company’s results, trends and on-going
performance. Accordingly, the Company has provided an analysis of operating results for fiscal 2006 as
compared to fiscal 2005 results presented on both a reported and a pro forma basis.
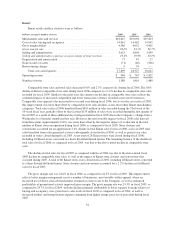
Fiscal 2006 revenues were $53.0 billion as compared to $49.1 billion (reported) and $54.3 billion (pro
forma) in fiscal 2005. As discussed above, the increase in fiscal 2006 revenues, as compared to reported revenues
for fiscal 2005, was primarily due to the inclusion of Sears for the entire year in fiscal 2006 and, to a lesser
degree, the inclusion of an additional week of sales in fiscal 2006. Fiscal 2006 revenues declined $1.3 billion, or
2.3%, to $53.0 billion, as compared to fiscal 2005 pro forma revenues of $54.3 billion, as lower comparable store
sales (as discussed above) and the impact of Kmart store closures were partially offset by the above-noted
additional week of sales recorded in the current year, and to a lesser degree, sales increases in Sears Domestic’s
home services business.
The gross margin rate was 28.7% in fiscal 2006, as compared to 27.4% (reported and pro forma) in fiscal
2005. Gross margin rates improved across all business segments: Kmart, Sears Domestic and Sears Canada, with
the increase primarily reflecting the above-noted improvements being realized in the Company’s apparel
businesses.
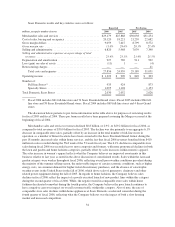
The selling and administrative expense rate was 21.8% in fiscal 2006, as compared to 22.0% (reported) and
22.4% (pro forma) for fiscal 2005. As noted above, the current year rate improvement primarily reflects
improved expense management, with the most notable improvements made at Sears Canada due in part to the
sale of Sears Canada’s Credit and Financial Products business in late fiscal 2005, as well as improved expense
management.
Depreciation and amortization was $1.1 billion for fiscal 2006, as compared to $0.9 billion (reported) and
$1.1 billion (pro forma) for fiscal 2005. The increased expense for fiscal 2006, as compared to the reported
expense for fiscal 2005, was primarily attributable to the inclusion of Sears for the entire year in fiscal 2006.
28