Sears 2006 Annual Report Download - page 30
Download and view the complete annual report
Please find page 30 of the 2006 Sears annual report below. You can navigate through the pages in the report by either clicking on the pages listed below, or by using the keyword search tool below to find specific information within the annual report.-
 1
1 -
2
-
3
-
4
-
5
-
6
-
7
-
8
-
9
-
10
-
11
-
12
-
13
-
14
-
15
-
16
-
17
-
18
-
19
-
 20
20 -
 21
21 -
 22
22 -
 23
23 -
 24
24 -
 25
25 -
 26
26 -
 27
27 -
 28
28 -
 29
29 -
 30
30 -
 31
31 -
 32
32 -
 33
33 -
 34
34 -
 35
35 -
 36
36 -
 37
37 -
 38
38 -
 39
39 -
 40
40 -
41
-
42
-
43
-
44
-
45
-
46
-
47
-
48
-
49
-
50
-
51
-
52
-
53
-
54
-
55
-
56
-
57
-
58
-
59
-
60
-
61
-
62
-
63
-
64
-
65
-
66
-
67
-
68
-
69
-
70
-
71
-
72
-
73
-
74
-
75
-
76
-
77
-
78
-
79
-
80
-
81
-
82
-
83
-
84
-
85
-
86
-
87
-
88
-
89
-
90
-
91
-
92
-
93
-
94
-
95
-
96
-
97
-
98
-
99
-
100
-
101
-
102
-
103
-
104
-
105
-
106
-
107
-
108
-
109
-
110
-
111
-
112
 |
 |
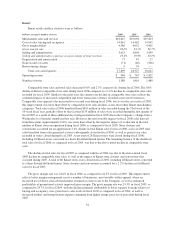
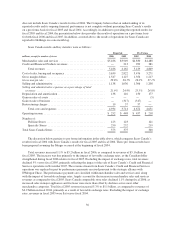
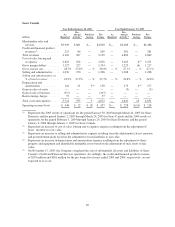
Total revenues were $49.1 billion (reported) and $54.3 billion (pro forma) for fiscal 2005, as compared to
total revenues of $19.8 billion (reported) and $56.0 billion (pro forma) for fiscal 2004. The increase in reported
revenues was attributable to the addition of Sears revenues of $30.0 billion in fiscal 2005, partially offset by a
decline in Kmart’s revenues of $0.7 billion, or 3.8%, due to a reduction in the total number of Kmart stores in
operation and a comparable store sales decline of 1.2% as discussed below. The decline in pro forma revenues
was primarily attributable to total revenue declines of 3.9% and 3.8% at Sears Domestic and Kmart, respectively,
partially offset by a 5.3% revenue increase at Sears Canada, primarily due to the impact of favorable exchange
rates. Total fiscal 2005 revenues also benefited from $153 million of sales being recorded during the first quarter
of fiscal 2005 as a result of three additional days being included in the fiscal 2005 period due to the Company’s
change from a Wednesday to a Saturday month end.
Domestic comparable store sales were down 5.3% in the aggregate for fiscal 2005, with Sears Domestic
comparable store sales declining 8.4% and Kmart comparable store sales declining 1.2%. Kmart’s fiscal 2005
comparable store sales decline was primarily due to lower transaction volumes across most businesses. Apparel
sales at Kmart increased in fiscal 2005 on a comparable store basis, but this improvement was more than offset
by sales declines in both home goods and the food and drug business. The sharper decline in Sears Domestic’s
fiscal 2005 comparable store sales relative to Kmart was due mainly to efforts initiated at Sears in 2005 to
improve gross margins by reducing reliance on certain promotional events. Disappointing performance within
Sears’ apparel business during 2005 was also a factor in the decline of Sears’ comparable store sales during fiscal
2005.
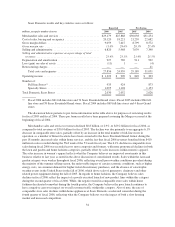
Gross margin was 27.4% (reported and pro forma) for fiscal 2005, as compared to 24.7% (reported) and
26.4% (pro forma) for fiscal 2004. The increase in reported gross margin was primarily attributable to the
addition of Sears, which had a higher overall gross margin rate than Kmart, in fiscal 2005. The increase in pro
forma margin in fiscal 2005, as compared to fiscal 2004, was primarily attributable to improvement in Sears
Domestic’s gross margin rate, mainly as a result of improved inventory management and the utilization of more
targeted clearance and promotional markdowns versus historical reliance on storewide events.
The selling and administrative expense rate was 22.0% (reported) and 22.4% (pro forma) for fiscal 2005, as
compared to 20.2% (reported) and 22.4% (pro forma) for fiscal 2004. The increase in the reported selling and
administrative expense rate was primarily attributable to the addition of Sears, which had a higher cost structure
than Kmart, in fiscal 2005. On a pro forma basis, selling and administrative expenses as a percentage of total
revenues remained unchanged between fiscal 2005 and fiscal 2004. While selling and administrative expenses
decreased by $398 million in fiscal 2005, primarily as a function of reduced payroll expenditures and cost-saving
initiatives, the selling and administrative expense rate was unchanged compared to fiscal 2004, as the impact of
these reductions was offset by lower expense leverage given lower overall sales, as well as increases at Sears
Canada in both associate stock-based compensation expense and marketing expense.
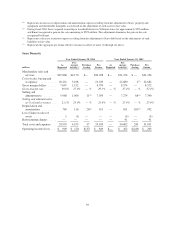
Depreciation and amortization was $932 million (reported) for fiscal 2005, as compared to $27 million
(reported) for fiscal 2004. The increase was primarily attributable to the addition of Sears, which accounted for
$885 million of the reported combined expense in fiscal 2005.
The Company realized gains on sales of assets of $39 million (reported) and $40 million (pro forma) for
fiscal 2005, as compared to $946 million (reported) and $356 million (pro forma) for fiscal 2004. During fiscal
2004, the Company entered into multiple agreements with Home Depot to sell four properties and assign 14
leased properties for an aggregate purchase price of $271 million, resulting in a total gain on sale of
$253 million. Also during fiscal 2004, Kmart sold four owned properties, assigned 45 leased properties and
leased one owned store to Sears for a total purchase price of approximately $576 million, resulting in a gain of
$599 million. This gain on transactions with Sears was excluded from the fiscal 2004 pro forma gain on sale of
assets amount of $356 million. Additionally, the Company sold certain other real and personal property, resulting
in net gains of $39 million and $94 million in fiscal 2005 and fiscal 2004, respectively. Included within the fiscal
2004 gains were $22 million related to the sale of owned, or assignment of leased, properties, $18 million related
30