Sears 2006 Annual Report Download - page 27
Download and view the complete annual report
Please find page 27 of the 2006 Sears annual report below. You can navigate through the pages in the report by either clicking on the pages listed below, or by using the keyword search tool below to find specific information within the annual report.-
 1
1 -
2
-
3
-
4
-
5
-
6
-
7
-
8
-
9
-
10
-
11
-
12
-
13
-
14
-
15
-
16
-
 17
17 -
 18
18 -
 19
19 -
 20
20 -
 21
21 -
 22
22 -
 23
23 -
 24
24 -
 25
25 -
 26
26 -
 27
27 -
 28
28 -
 29
29 -
 30
30 -
 31
31 -
 32
32 -
 33
33 -
 34
34 -
 35
35 -
 36
36 -
 37
37 -
38
-
39
-
40
-
41
-
42
-
43
-
44
-
45
-
46
-
47
-
48
-
49
-
50
-
51
-
52
-
53
-
54
-
55
-
56
-
57
-
58
-
59
-
60
-
61
-
62
-
63
-
64
-
65
-
66
-
67
-
68
-
69
-
70
-
71
-
72
-
73
-
74
-
75
-
76
-
77
-
78
-
79
-
80
-
81
-
82
-
83
-
84
-
85
-
86
-
87
-
88
-
89
-
90
-
91
-
92
-
93
-
94
-
95
-
96
-
97
-
98
-
99
-
100
-
101
-
102
-
103
-
104
-
105
-
106
-
107
-
108
-
109
-
110
-
111
-
112
 |
 |
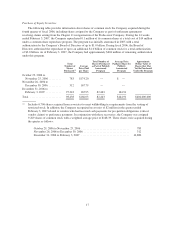
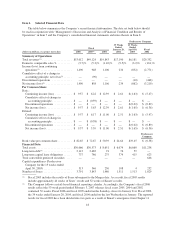
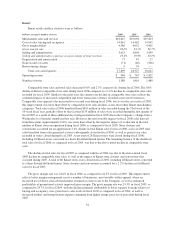
(comprised of 52 weeks). The Company recorded a total of $711 million in revenues during the 53rd week of
fiscal 2006. Fiscal 2006 revenues declined $1.3 billion, or 2.3%, to $53.0 billion, as compared to fiscal 2005 pro
forma revenues of $54.3 billion. The decline primarily reflects lower comparable store sales and the impact of
Kmart store closures, partially offset by the above-noted additional week of sales recorded in the current year,
and to a lesser degree, sales increases in Sears Domestic’s home services business.
The Company aims to pursue a course of disciplined revenue growth, whereby sales growth opportunities
are analyzed to ensure that they provide sufficient possibility of improving the Company’s profitability and are
consistent with the Holdings’ mission of building long-term customer relationships. As noted above, in the near
term, management believes the greatest overall benefit to Holdings’ profitability will not come from increasing
the Company’s store base, but rather primarily from better utilizing existing assets to deliver more value to
customers.
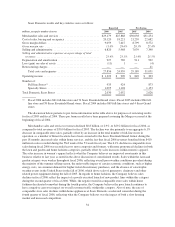
Gross Margin Rate
Gross margin as a percentage of merchandise sales and services revenue (“gross margin rate”) was 28.7% in
fiscal 2006, as compared to 27.4% (reported and pro forma) in fiscal 2005. The overall improvement in the
Company’s gross margin rates during fiscal 2006 more than offset the unfavorable profit impact of the above-
noted revenue declines. The Company remained focused on the improvement of gross margins during fiscal
2006, and gross margin rates improved across all business segments: Kmart, Sears Domestic and Sears Canada.
The overall improved gross margin rate primarily reflects improvements realized in the Company’s apparel
businesses. Sears Domestic was the largest contributor to the overall margin rate improvement, as gross margin
rates at Sears Domestic improved across most full-line store merchandise categories, with pronounced
improvements in apparel. Kmart’s margins improved, but to a lesser degree than at Sears Domestic.
The Company believes the improved gross margin rate performance of its apparel business, and within
women’s apparel at Sears Domestic in particular, reflects the impact of having better product assortments in
place relative to last year. This improvement in assortments lowered apparel markdowns during the current year
relative to prior year levels. Additional markdowns were taken in the latter half of 2005 to clear fashion apparel
given poor customer response to Sears Domestic full-line store apparel offerings last year. Additionally, apparel
gross margins at both Kmart and Sears Domestic benefited from fiscal 2006 efforts to procure products at a lower
cost to the Company including increased utilization of direct-sourced merchandise, particularly at Sears
Domestic, which had historically not utilized direct-sourcing to the extent of its use at Kmart. Also, Sears
Domestic’s home services and Lands’ End businesses contributed to the overall improved gross margins for
Holdings during fiscal 2006. As was the case within other apparel businesses during fiscal 2006, the
improvement in Lands’ End’s gross margin reflects more extensive and effective use of direct-sourced
merchandise, as well as the favorable impact of pricing initiatives and stronger in-season sales results.
Selling and Administrative Expense Rate
Selling and administrative expenses as a percentage of total revenues (“selling and administrative expense
rate”) was 21.8% in fiscal 2006, as compared to 22.0% (reported) and 22.4% (pro forma) for fiscal 2005. The
Company remained focused on disciplined spending in fiscal 2006, and the Company’s selling and administrative
expense rate improved across all segments, with the most notable improvements made at Sears Canada. The
current year rate improvement primarily reflects improved expense management, particularly within payroll and
benefits. Sears Canada’s improvement was due in part to the sale of Sears Canada’s Credit and Financial
Products business in late fiscal 2005, as well as improved expense management.
Interest and Investment Income
The Company recorded interest and investment income of $254 million in fiscal 2006, as compared with
$127 million (reported) and $159 million (pro forma) in fiscal 2005. The increased interest and investment
27