Sears 2006 Annual Report Download - page 38
Download and view the complete annual report
Please find page 38 of the 2006 Sears annual report below. You can navigate through the pages in the report by either clicking on the pages listed below, or by using the keyword search tool below to find specific information within the annual report.-
 1
1 -
2
-
3
-
4
-
5
-
6
-
7
-
8
-
9
-
10
-
11
-
12
-
13
-
14
-
15
-
16
-
17
-
18
-
19
-
20
-
21
-
22
-
23
-
24
-
25
-
26
-
27
-
 28
28 -
 29
29 -
 30
30 -
 31
31 -
 32
32 -
 33
33 -
 34
34 -
 35
35 -
 36
36 -
 37
37 -
 38
38 -
 39
39 -
 40
40 -
 41
41 -
 42
42 -
 43
43 -
 44
44 -
 45
45 -
 46
46 -
 47
47 -
 48
48 -
49
-
50
-
51
-
52
-
53
-
54
-
55
-
56
-
57
-
58
-
59
-
60
-
61
-
62
-
63
-
64
-
65
-
66
-
67
-
68
-
69
-
70
-
71
-
72
-
73
-
74
-
75
-
76
-
77
-
78
-
79
-
80
-
81
-
82
-
83
-
84
-
85
-
86
-
87
-
88
-
89
-
90
-
91
-
92
-
93
-
94
-
95
-
96
-
97
-
98
-
99
-
100
-
101
-
102
-
103
-
104
-
105
-
106
-
107
-
108
-
109
-
110
-
111
-
112
 |
 |

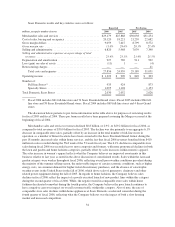
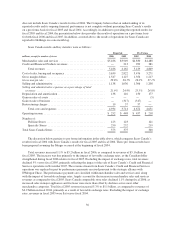
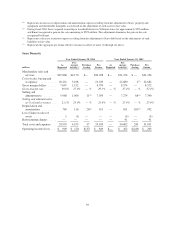
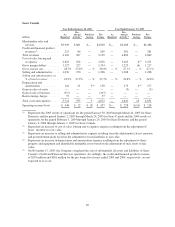
PRO FORMA RECONCILIATION
The following tables provide a reconciliation from the as reported results to the pro forma results presented
above for Sears Holdings for the years ended January 28, 2006 and January 26, 2005, respectively, as well as for
Sears Domestic and Sears Canada for the years ended January 28, 2006 and January 29, 2005, respectively.
Sears Holdings
Year Ended January 28, 2006 Year Ended January 26, 2005
millions, except per share data
As
Reported
Pre-
merger
Activity(1)
Purchase
Acctng
Pro
Forma
As
Reported
Pre-
merger
Activity(1)
Purchase
Acctng
Pro
Forma
Merchandise sales and services ..... $48,911 $5,051 $— $53,962 $19,843 $35,742 $ — $55,585
Credit and financial products
revenues ..................... 213 86 — 299 — 381 — 381
Total revenues .............. 49,124 5,137 — 54,261 19,843 36,123 — 55,966
Cost of sales, buying and
occupancy ................... 35,505 3,672 — 39,177 14,942 25,945 8(2) 40,895
Gross margin dollars ............. 13,406 1,379 — 14,785 4,901 9,797 (8) 14,690
Gross margin rate ............... 27.4% 27.3% — % 27.4% 24.7% 27.4% — % 26.4%
Selling and administrative ......... 10,808 1,330 11(3) 12,149 3,999 8,482 66(3) 12,547
Selling and administrative as % of
total revenues ................ 22.0% 25.9% — % 22.4% 20.2% 23.5% — % 22.4%
Depreciation and amortization ..... 932 147 29
(4) 1,108 27 984 185(4) 1,196
Gain on sales of assets ............ (39) (1) — (40) (946) (9) 599(5) (356)
Gain on sale of business .......... (317) — — (317) — — — —
Restructuring charges ............ 111 — — 111 — 41 — 41
Total costs and expenses .......... 47,000 5,148 40 52,188 18,022 35,443 858 54,323
Operating income (loss) .......... 2,124 (11) (40) 2,073 1,821 680 (858) 1,643
Interest and investment income ..... (127) (32) — (159) (41) (112) — (153)
Interest expense ................. 323 57 (2)
(6) 378 146 319 (23)(6) 442
Other income ................... (37) — — (37) (59) (8) — (67)
Income before income taxes,
minority interest and cumulative
effect of change in accounting
principle ..................... 1,965 (36) (38) 1,891 1,775 481 (835) 1,421
Income tax expense (benefit) ...... 716 4 (15)(7) 705 669 141 (319)(7) 491
Minority interest ................ 301 6 — 307 — 46 — 46
Income before cumulative effect of
change in accounting principle . . . 948 (46) (23) 879 1,106 294 (516) 884
Cumulative effect of change in
accounting principle, net of tax . . . (90) — — (90) — — — —
NET INCOME (LOSS) .......... $ 858 $ (46) $ (23) $ 789 $ 1,106 $ 294 $(516) $ 884
Diluted earnings per share before
cumulative effect of change in
accounting principle ........... $ 6.17 $ 5.40 $ 11.00 $ 5.40
Diluted earnings per share ......... $ 5.59 $ 4.85 $ 11.00 $ 5.40
(1) Represents the 2005 results of operations for the period January 30, 2005 through March 24, 2005 for Sears Domestic
and the period January 2, 2005 through March 24, 2005 for Sears Canada and the 2004 results of operations for the
period February 1, 2004 through January 29, 2005 for Sears Domestic and the period January 4, 2004 through January 1,
2005 for Sears Canada.
(2) Represents an increase to cost of sales, buying and occupancy expense resulting from the adjustment to Sears’ inventory
based on the adjustment of such assets to fair value.
(3) Represents an increase to selling and administrative expense resulting from the adjustment to Sears’ pension and
postretirement plans based on the adjustment of such liabilities to fair value.
38