Sears 2006 Annual Report Download - page 41
Download and view the complete annual report
Please find page 41 of the 2006 Sears annual report below. You can navigate through the pages in the report by either clicking on the pages listed below, or by using the keyword search tool below to find specific information within the annual report.-
 1
1 -
2
-
3
-
4
-
5
-
6
-
7
-
8
-
9
-
10
-
11
-
12
-
13
-
14
-
15
-
16
-
17
-
18
-
19
-
20
-
21
-
22
-
23
-
24
-
25
-
26
-
27
-
28
-
29
-
30
-
 31
31 -
 32
32 -
 33
33 -
 34
34 -
 35
35 -
 36
36 -
 37
37 -
 38
38 -
 39
39 -
 40
40 -
 41
41 -
 42
42 -
 43
43 -
 44
44 -
 45
45 -
 46
46 -
 47
47 -
 48
48 -
 49
49 -
 50
50 -
 51
51 -
52
-
53
-
54
-
55
-
56
-
57
-
58
-
59
-
60
-
61
-
62
-
63
-
64
-
65
-
66
-
67
-
68
-
69
-
70
-
71
-
72
-
73
-
74
-
75
-
76
-
77
-
78
-
79
-
80
-
81
-
82
-
83
-
84
-
85
-
86
-
87
-
88
-
89
-
90
-
91
-
92
-
93
-
94
-
95
-
96
-
97
-
98
-
99
-
100
-
101
-
102
-
103
-
104
-
105
-
106
-
107
-
108
-
109
-
110
-
111
-
112
 |
 |

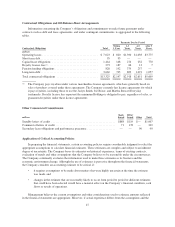
ANALYSIS OF CONSOLIDATED FINANCIAL CONDITION
Cash and Cash Equivalents
Cash and cash equivalents include all highly liquid investments with original maturities of three months or
less at the date of purchase. The Company’s cash and cash equivalents balances as of the fiscal years ended
February 3, 2007 and January 28, 2006 are detailed in the following table.
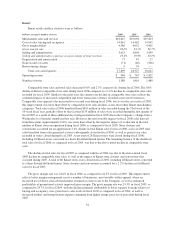
Millions 2006 2005
Domestic
Cash and cash equivalents ............................................. $2,484 $3,208
Cash posted as collateral .............................................. 722 466
Credit card deposits in transit .......................................... 117 102
Total domestic cash and cash equivalents ................................. 3,323 3,776
Sears Canada ....................................................... 645 664
Total cash and cash equivalents ........................................ $3,968 $4,440
The Company had cash and cash equivalents of $4.0 billion at February 3, 2007 as compared to $4.4 billion
at January 28, 2006. The decline in cash and cash equivalents from January 28, 2006 is primarily attributable to
share repurchases ($816 million), debt repayments, net of new borrowings ($434 million), capital expenditures
($513 million) and cash used in the acquisition of additional interests in Sears Canada ($282 million), partially
offset by cash flows from operating activities of $1.4 billion, which included pension contributions of $355
million, and an increase in merchandise inventories as further discussed below.
The Company’s invested cash may include, from time to time, investments in, but not limited to,
commercial paper, U.S. federal, state and municipal government securities, floating-rate notes, repurchase
agreements and money market funds. All invested cash amounts are readily available to the Company and
included $43 million and $634 million as of fiscal year end 2006 and fiscal year end 2005, respectively, invested
in support of the Company’s wholly-owned insurance subsidiary. Additionally, as explained below, the
Company’s Board of Directors has delegated authority to direct investment of the Company’s surplus cash to
Edward S. Lampert, subject to various limitations that have been or may be from time to time adopted by the
Board of Directors and/or the Finance Committee of the Board of Directors.
The Company has posted cash collateral for certain outstanding letters of credit and self-insurance
programs. Such cash collateral is classified within cash and cash equivalents given its ready availability to the
Company as the Company has the ability to substitute letters of credit at any time for this cash collateral.
Credit card deposits in transit include deposits in-transit from banks for payments related to third-party
credit card and debit card transactions.
The Company classifies outstanding checks in excess of funds on deposit within other current liabilities and
reduces cash and cash equivalents when these checks clear the bank on which they were drawn. Outstanding
checks in excess of funds on deposit were $353 million and $444 million for the fiscal year ended 2006 and
2005, respectively.
Investment of Available Capital
Since the Merger, the Company’s cash flows have exceeded its working capital, financing and capital
investment needs, and management expects that the Company’s cash flows will continue to exceed its annual
operating cash needs for the foreseeable future. The Company regularly evaluates how best to deploy capital to
increase shareholder value. The Company has and will continue to invest in its businesses to improve the
41