Sears 2006 Annual Report Download - page 24
Download and view the complete annual report
Please find page 24 of the 2006 Sears annual report below. You can navigate through the pages in the report by either clicking on the pages listed below, or by using the keyword search tool below to find specific information within the annual report.-
 1
1 -
2
-
3
-
4
-
5
-
6
-
7
-
8
-
9
-
10
-
11
-
12
-
13
-
 14
14 -
 15
15 -
 16
16 -
 17
17 -
 18
18 -
 19
19 -
 20
20 -
 21
21 -
 22
22 -
 23
23 -
 24
24 -
 25
25 -
 26
26 -
 27
27 -
 28
28 -
 29
29 -
 30
30 -
 31
31 -
 32
32 -
 33
33 -
 34
34 -
35
-
36
-
37
-
38
-
39
-
40
-
41
-
42
-
43
-
44
-
45
-
46
-
47
-
48
-
49
-
50
-
51
-
52
-
53
-
54
-
55
-
56
-
57
-
58
-
59
-
60
-
61
-
62
-
63
-
64
-
65
-
66
-
67
-
68
-
69
-
70
-
71
-
72
-
73
-
74
-
75
-
76
-
77
-
78
-
79
-
80
-
81
-
82
-
83
-
84
-
85
-
86
-
87
-
88
-
89
-
90
-
91
-
92
-
93
-
94
-
95
-
96
-
97
-
98
-
99
-
100
-
101
-
102
-
103
-
104
-
105
-
106
-
107
-
108
-
109
-
110
-
111
-
112
 |
 |

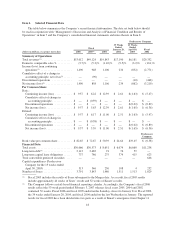
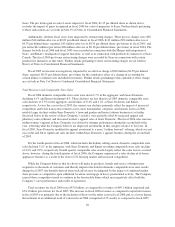
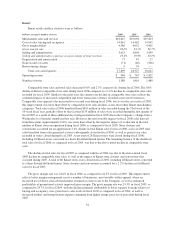
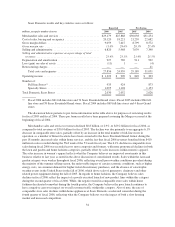
Holdings Reported Results
Holdings’ consolidated results of operations for fiscal 2006, 2005 and 2004, presented on both a reported
and a pro forma basis are summarized below.
Reported Pro Forma
2006 2005 2004 2005 2004
Merchandise sales and services ..................... $53,012 $48,911 $19,843 $53,962 $55,585
Credit and financial products revenues ............... — 213 — 299 381
Total revenues ............................... 53,012 49,124 19,843 54,261 55,966
Cost of sales, buying and occupancy ................. 37,820 35,505 14,942 39,177 40,895
Gross margin dollars .............................. 15,192 13,406 4,901 14,785 14,690
Gross margin rate ................................ 28.7% 27.4% 24.7% 27.4% 26.4%
Selling and administrative ......................... 11,581 10,808 3,999 12,149 12,547
Selling and administrative expense as a percentage of
total revenues ................................. 21.8% 22.0% 20.2% 22.4% 22.4%
Depreciation and amortization ...................... 1,142 932 27 1,108 1,196
Gain on sales of assets ............................ (82) (39) (946) (40) (356)
Gain on sale of business ........................... — (317) — (317) —
Restructuring charges ............................. 28 111 — 111 41
Total costs and expenses ....................... 50,489 47,000 18,022 52,188 54,323
Operating income ................................ 2,523 2,124 1,821 2,073 1,643
Interest and investment income ..................... (254) (127) (41) (159) (153)
Interest expense ................................. 337 323 146 378 442
Other income ................................... (24) (37) (59) (37) (67)
Income before income taxes, minority interest and
cumulative effect of change in accounting principle . . . 2,464 1,965 1,775 1,891 1,421
Income taxes .................................... 930 716 669 705 491
Minority interest ................................. 44 301 — 307 46
Income before cumulative effect of change in accounting
principle ..................................... 1,490 948 1,106 879 884
Cumulative effect of change in accounting principle, net
of tax(1) ...................................... — (90) — (90) —
NET INCOME ................................. $ 1,490 $ 858 $ 1,106 $ 789 $ 884
Diluted earnings per share before cumulative effect of
change in accounting principle .................... $ 9.57 $ 6.17 $ 11.00 $ 5.40 $ 5.40
Cumulative effect of change in accounting principle(1) . . . — (0.58) — (0.55) —
Diluted earnings per share ......................... $ 9.57 $ 5.59 $ 11.00 $ 4.85 $ 5.40
(1) Effective January 27, 2005, Kmart changed its method of accounting for certain indirect buying,
warehousing and distribution costs and, accordingly, the Company recorded the cumulative effect of this
change in accounting principle in fiscal 2005. Further information regarding this change in accounting is set
forth in Note 3 of Notes to Consolidated Financial Statements.
Fiscal 2006 Summary
The following discussion is designed to provide the reader with an overview of fiscal 2006 financial results,
with particular emphasis on significant events and transactions that had a disproportionate effect on the
Company’s results for the fiscal years presented. Further discussion regarding the Company’s operating
performance follows this overview section.
24