Sears 2006 Annual Report Download - page 55
Download and view the complete annual report
Please find page 55 of the 2006 Sears annual report below. You can navigate through the pages in the report by either clicking on the pages listed below, or by using the keyword search tool below to find specific information within the annual report.-
 1
1 -
2
-
3
-
4
-
5
-
6
-
7
-
8
-
9
-
10
-
11
-
12
-
13
-
14
-
15
-
16
-
17
-
18
-
19
-
20
-
21
-
22
-
23
-
24
-
25
-
26
-
27
-
28
-
29
-
30
-
31
-
32
-
33
-
34
-
35
-
36
-
37
-
38
-
39
-
40
-
41
-
42
-
43
-
44
-
 45
45 -
 46
46 -
 47
47 -
 48
48 -
 49
49 -
 50
50 -
 51
51 -
 52
52 -
 53
53 -
 54
54 -
 55
55 -
 56
56 -
 57
57 -
 58
58 -
 59
59 -
 60
60 -
 61
61 -
 62
62 -
 63
63 -
 64
64 -
 65
65 -
66
-
67
-
68
-
69
-
70
-
71
-
72
-
73
-
74
-
75
-
76
-
77
-
78
-
79
-
80
-
81
-
82
-
83
-
84
-
85
-
86
-
87
-
88
-
89
-
90
-
91
-
92
-
93
-
94
-
95
-
96
-
97
-
98
-
99
-
100
-
101
-
102
-
103
-
104
-
105
-
106
-
107
-
108
-
109
-
110
-
111
-
112
 |
 |

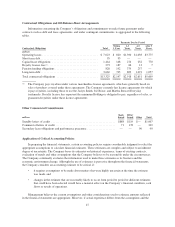
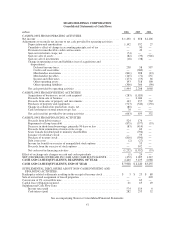
SEARS HOLDINGS CORPORATION
Consolidated Statements of Income
millions, except per share data 2006 2005 2004
REVENUES
Merchandise sales and services ........................................ $53,012 $48,911 $19,843
Credit and financial products revenues .................................. — 213 —
Total revenues ................................................. 53,012 49,124 19,843
COSTS AND EXPENSES
Cost of sales, buying and occupancy .................................... 37,820 35,505 14,942
Selling and administrative ............................................ 11,581 10,808 3,999
Depreciation and amortization ......................................... 1,142 932 27
Gain on sales of assets ............................................... (82) (39) (946)
Gain on sale of business .............................................. — (317) —
Restructuring charges ................................................ 28 111 —
Total costs and expenses ......................................... 50,489 47,000 18,022
Operating income ................................................... 2,523 2,124 1,821
Interest and investment income ........................................ (254) (127) (41)
Interest expense .................................................... 337 323 146
Other income ...................................................... (24) (37) (59)
Income before income taxes, minority interest and cumulative effect of change in
accounting principle ............................................... 2,464 1,965 1,775
Income taxes ....................................................... 930 716 669
Minority interest .................................................... 44 301 —
Income before cumulative effect of change in accounting principle ............ 1,490 948 1,106
Cumulative effect of change in accounting principle (net of income tax benefit of
$58) ............................................................ — (90) —
NET INCOME .................................................... $ 1,490 $ 858 $ 1,106
EARNINGS PER COMMON SHARE
BASIC
Earnings per share before cumulative effect of change in accounting
principle ................................................ $ 9.57 $ 6.22 $ 12.39
Cumulative effect of change in accounting principle ............... — (0.59) —
Earnings per share .......................................... $ 9.57 $ 5.63 $ 12.39
DILUTED.....................................................
Earnings per share before cumulative effect of change in accounting
principle ................................................ $ 9.57 $ 6.17 $ 11.00
Cumulative effect of change in accounting principle ............... — (0.58) —
Earnings per share .......................................... $ 9.57 $ 5.59 $ 11.00
Basic weighted average common shares outstanding ....................... 155.6 152.5 89.3
Diluted weighted average common shares outstanding ...................... 155.7 153.6 101.4
See accompanying Notes to Consolidated Financial Statements.
55