Sears 2006 Annual Report Download - page 36
Download and view the complete annual report
Please find page 36 of the 2006 Sears annual report below. You can navigate through the pages in the report by either clicking on the pages listed below, or by using the keyword search tool below to find specific information within the annual report.-
 1
1 -
2
-
3
-
4
-
5
-
6
-
7
-
8
-
9
-
10
-
11
-
12
-
13
-
14
-
15
-
16
-
17
-
18
-
19
-
20
-
21
-
22
-
23
-
24
-
25
-
 26
26 -
 27
27 -
 28
28 -
 29
29 -
 30
30 -
 31
31 -
 32
32 -
 33
33 -
 34
34 -
 35
35 -
 36
36 -
 37
37 -
 38
38 -
 39
39 -
 40
40 -
 41
41 -
 42
42 -
 43
43 -
 44
44 -
 45
45 -
 46
46 -
47
-
48
-
49
-
50
-
51
-
52
-
53
-
54
-
55
-
56
-
57
-
58
-
59
-
60
-
61
-
62
-
63
-
64
-
65
-
66
-
67
-
68
-
69
-
70
-
71
-
72
-
73
-
74
-
75
-
76
-
77
-
78
-
79
-
80
-
81
-
82
-
83
-
84
-
85
-
86
-
87
-
88
-
89
-
90
-
91
-
92
-
93
-
94
-
95
-
96
-
97
-
98
-
99
-
100
-
101
-
102
-
103
-
104
-
105
-
106
-
107
-
108
-
109
-
110
-
111
-
112
 |
 |

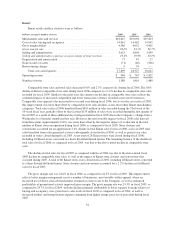
does not include Sears Canada’s results for fiscal 2004. The Company believes that an understanding of its
reported results and its ongoing financial performance is not complete without presenting Sears Canada’s results
on a pro forma basis for fiscal 2005 and fiscal 2004. Accordingly, in addition to providing the reported results for
fiscal 2005 and fiscal 2004, the presentation below also provides the results of operations on a pro forma basis
for both fiscal 2006 and fiscal 2005. In addition, as noted above, the results of operations for Sears Canada are
reported to Holdings on a one-month lag.
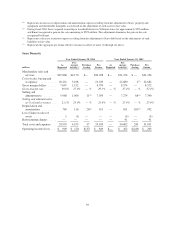
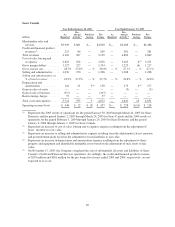
Sears Canada results and key statistics were as follows:
Reported Pro Forma
millions, except for number of stores 2006 2005 2005 2004
Merchandise sales and services ................................ $5,186 $3,949 $4,830 $4,488
Credit and Financial Products revenues .......................... — 213 299 381
Total revenues ......................................... 5,186 4,162 5,129 4,869
Cost of sales, buying and occupancy ............................ 3,639 2,822 3,476 3,271
Gross margin dollars ........................................ 1,547 1,127 1,354 1,217
Gross margin rate .......................................... 29.8% 28.5% 28.0% 27.1%
Selling and administrative .................................... 1,138 1,036 1,306 1,208
Selling and administrative expenses as a percentage of total
revenues ................................................ 21.9% 24.9% 25.5% 24.8%
Depreciation and amortization ................................. 138 116 150 177
Gain on sales of assets ....................................... — — — (5)
Gain on sale of business ...................................... — (317) (317) —
Restructuring charges ........................................ 19 57 57 —
Total costs and expenses ................................. 4,934 3,714 4,672 4,651
Operating income ........................................... $ 252 $ 448 $ 457 $ 218
Number of:
Full-line Stores ......................................... 123 123 121
Specialty Stores ........................................ 250 252 219
Total Sears Canada Stores .................................... 373 375 340
The discussion below pertains to pro forma information in the table above, which compares Sears Canada’s
results for fiscal 2006 with Sears Canada’s results for fiscal 2005 and fiscal 2004. These pro forma results have
been prepared assuming the Merger occurred at the beginning of fiscal 2004.
Total revenues increased 1.1% to $5.2 billion in fiscal 2006, as compared to revenues of $5.1 billion in
fiscal 2005. The increase was due primarily to the impact of favorable exchange rates, as the Canadian dollar
strengthened during fiscal 2006 relative to fiscal 2005. Excluding the impact of exchange rates, total revenues
declined 5% versus fiscal 2005, primarily reflecting the impact of the sale of Sears Canada’s Credit and Financial
Services operations in November 2005. The revenue stream from Sears Canada’s Credit and Financial Services
operations was replaced in part by performance payments received pursuant to the strategic alliance with
JPMorgan Chase. The performance payments are classified within merchandise sales and services and, along
with the impact of favorable exchange rates, largely account for the increase in merchandise sales and services
revenues as compared to fiscal 2005. Sears Canada comparable store sales declined 1.1% during fiscal 2006, as
increased sales in major appliances and footwear were more than offset by declines across most other
merchandise categories. Total fiscal 2005 revenues increased 5.3% to $5.1 billion, as compared to revenues of
$4.9 billion in fiscal 2004, primarily as a result of favorable exchange rates. Excluding the impact of exchange
rates, revenues in fiscal 2005 were flat versus fiscal 2004.
36