Sears 2006 Annual Report Download - page 35
Download and view the complete annual report
Please find page 35 of the 2006 Sears annual report below. You can navigate through the pages in the report by either clicking on the pages listed below, or by using the keyword search tool below to find specific information within the annual report.-
 1
1 -
2
-
3
-
4
-
5
-
6
-
7
-
8
-
9
-
10
-
11
-
12
-
13
-
14
-
15
-
16
-
17
-
18
-
19
-
20
-
21
-
22
-
23
-
24
-
 25
25 -
 26
26 -
 27
27 -
 28
28 -
 29
29 -
 30
30 -
 31
31 -
 32
32 -
 33
33 -
 34
34 -
 35
35 -
 36
36 -
 37
37 -
 38
38 -
 39
39 -
 40
40 -
 41
41 -
 42
42 -
 43
43 -
 44
44 -
 45
45 -
46
-
47
-
48
-
49
-
50
-
51
-
52
-
53
-
54
-
55
-
56
-
57
-
58
-
59
-
60
-
61
-
62
-
63
-
64
-
65
-
66
-
67
-
68
-
69
-
70
-
71
-
72
-
73
-
74
-
75
-
76
-
77
-
78
-
79
-
80
-
81
-
82
-
83
-
84
-
85
-
86
-
87
-
88
-
89
-
90
-
91
-
92
-
93
-
94
-
95
-
96
-
97
-
98
-
99
-
100
-
101
-
102
-
103
-
104
-
105
-
106
-
107
-
108
-
109
-
110
-
111
-
112
 |
 |
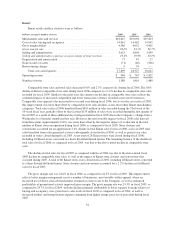
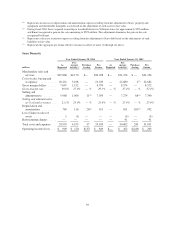
The 6.1% decline in Sears Domestic comparable store sales during fiscal 2006 compares to an 8.4% decline
in comparable store sales recorded for fiscal 2005. The decline in Sears Domestic comparable store sales during
fiscal 2005 primarily reflected efforts initiated in fiscal 2005 to improve gross margin rates by reducing reliance
on certain promotional events and, to a lesser extent, the above-noted poor customer response to full-line store
fashion offerings.
Gross margin rates improved for a second year at Sears Domestic, reaching 31.0% for fiscal 2006, as
compared to 29.3% and 27.4% for fiscal 2005 and fiscal 2004, respectively. The 170 basis point improvement in
gross margin rate realized during fiscal 2006 was due primarily to improved apparel margins as described above
in the discussion of consolidated results. Also, the home services and Lands’ End businesses contributed to the
overall improved gross margins during fiscal 2006. As was the case within other apparel businesses during fiscal
2006, the improvement in Lands’ End’s gross margin reflects more extensive and effective use of direct-sourced
merchandise, as well as the favorable impact of pricing initiatives and stronger in-season sales results. The 190
basis point improvement in Sears Domestic’s gross margin rate recorded during fiscal 2005, as compared to
fiscal 2004, was primarily attributable to improved inventory management and the utilization of more targeted
clearance and promotional markdowns versus historical reliance on storewide events. The margin benefit derived
in fiscal 2005 from better inventory management was partially offset by lower expense leverage relative to
occupancy costs in that year due to lower sales levels and higher utilities and energy costs.
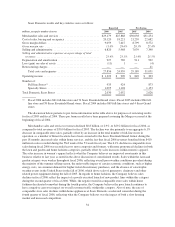
The selling and administrative expense rate was 23.4% for fiscal 2006, as compared to 23.4% and 23.5% for
fiscal 2005 and fiscal 2004, respectively. As was the case in fiscal 2005, the expense rate for fiscal 2006 was
largely unchanged from prior year, as expense reductions across a number of categories were offset by lower
expense leverage given lower sales levels. The expense reduction in fiscal 2006 included, most notably,
reductions in both marketing and payroll and benefits, which accounted for approximately 40 basis points and 10
basis points of improvement in the overall rate, respectively; however, the benefit derived from these and other
reductions was offset by lower expense leverage. Sears Domestic’s selling and administrative expense for fiscal
2006 included the favorable impact of a $17 million gain recorded in connection with settlement of Visa/
MasterCard antitrust litigation this year, and also benefited from the fact that fiscal 2005 expenses included $37
million of Merger-related costs; however, the favorable impact derived from these items was more than offset by
the recognition of a $74 million accrual in the fourth quarter of fiscal 2006 in connection with a pre-Merger legal
matter concerning Sears’ redemption of certain bonds in 2004 as discussed above.
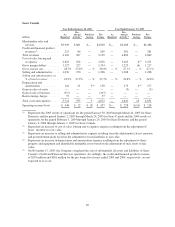
Depreciation and amortization expense was $927 million, $911 million and $992 million for fiscal 2006,
fiscal 2005 and fiscal 2004, respectively. The higher level of depreciation and amortization expense for fiscal
2004 was due primarily to higher capital expenditure levels, as compared with fiscal 2006 and fiscal 2005, and
additional depreciation recognized during fiscal 2004 in connection with shortening the estimated remaining
useful lives of certain information technology assets that were sold to an outside IT service provider during that
year.
Operating income for fiscal 2006 increased compared to fiscal 2005, primarily as a function of increased
gross margin dollars, as well as lower selling and administrative costs. Operating income for fiscal 2005
increased compared to fiscal 2004 for the same reasons, as well as a result of lower depreciation and amortization
expense, and due to the fact that fiscal 2004 was unfavorably impacted by a $41 million charge recorded as part
of a productivity initiative.
Sears Canada
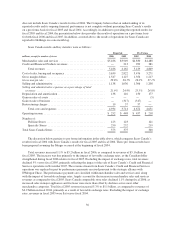
Sears Canada, a consolidated, 70%-owned subsidiary of Sears, conducts retail and credit operations. In
November 2005, Sears Canada completed the sale of its Credit and Financial Services operations.
As noted above, the consolidated statement of income for Holdings includes Sears Canada’s results only for
the period subsequent to the Merger, or from March 24, 2005 through December 31, 2005 for fiscal 2005, and
35