Sears 2006 Annual Report Download - page 40
Download and view the complete annual report
Please find page 40 of the 2006 Sears annual report below. You can navigate through the pages in the report by either clicking on the pages listed below, or by using the keyword search tool below to find specific information within the annual report.-
 1
1 -
2
-
3
-
4
-
5
-
6
-
7
-
8
-
9
-
10
-
11
-
12
-
13
-
14
-
15
-
16
-
17
-
18
-
19
-
20
-
21
-
22
-
23
-
24
-
25
-
26
-
27
-
28
-
29
-
 30
30 -
 31
31 -
 32
32 -
 33
33 -
 34
34 -
 35
35 -
 36
36 -
 37
37 -
 38
38 -
 39
39 -
 40
40 -
 41
41 -
 42
42 -
 43
43 -
 44
44 -
 45
45 -
 46
46 -
 47
47 -
 48
48 -
 49
49 -
 50
50 -
51
-
52
-
53
-
54
-
55
-
56
-
57
-
58
-
59
-
60
-
61
-
62
-
63
-
64
-
65
-
66
-
67
-
68
-
69
-
70
-
71
-
72
-
73
-
74
-
75
-
76
-
77
-
78
-
79
-
80
-
81
-
82
-
83
-
84
-
85
-
86
-
87
-
88
-
89
-
90
-
91
-
92
-
93
-
94
-
95
-
96
-
97
-
98
-
99
-
100
-
101
-
102
-
103
-
104
-
105
-
106
-
107
-
108
-
109
-
110
-
111
-
112
 |
 |

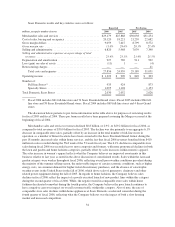
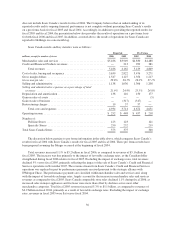
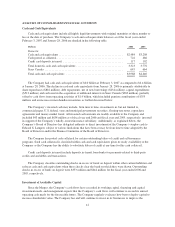
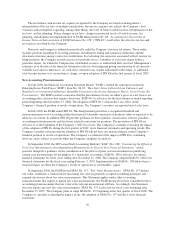
Sears Canada
Year Ended January 28, 2006 Year Ended January 29, 2005
millions
As
Reported
Pre-
merger
Activity(1)
Purchase
Acctng
Pro
Forma
As
Reported
Pre-
merger
Activity(1)
Purchase
Acctng
Pro
Forma
Merchandise sales and
services ................. $3,949 $ 881 $— $4,830 $— $4,488 $— $4,488
Credit and financial product
revenues(5) .............. 213 86 — 299 — 381 — 381
Total revenues ............. 4,162 967 — 5,129 — 4,869 — 4,869
Cost of sales, buying and
occupancy .............. 2,822 654 — 3,476 — 3,265 6(2) 3,271
Gross margin dollars ........ 1,127 227 — 1,354 — 1,223 (6) 1,217
Gross margin rate .......... 28.5% 25.8% — % 28.0% — % 27.3% — % 27.1%
Selling and administrative .... 1,036 270 — 1,306 — 1,208 — 1,208
Selling and administrative as
% of total revenues ....... 24.9% 27.9% — % 25.5% — % 24.8% — % 24.8%
Depreciation and
amortization ............. 116 31 3
(4) 150 — 173 4(4) 177
Gain on sales of assets ....... — — — — — (5) — (5)
Gain on sale of business ...... (317) — — (317) — — — —
Restructuring charges ....... 57 — — 57 — — — —
Total costs and expenses ..... 3,714 955 3 4,672 — 4,641 10 4,651
Operating income (loss) ...... $ 448 $ 12 $ (3) $ 457 $— $ 228 $(10) $ 218
(1) Represents the 2005 results of operations for the period January 30, 2005 through March 24, 2005 for Sears
Domestic and the period January 2, 2005 through March 24, 2005 for Sears Canada and the 2004 results of
operations for the period February 1, 2004 through January 29, 2005 for Sears Domestic and the period
January 4, 2004 through January 1, 2005 for Sears Canada.
(2) Represents an increase to cost of sales, buying and occupancy expense resulting from the adjustment of
Sears’ inventory to fair value.
(3) Represents an increase to selling and administrative expense resulting from the adjustment to Sears’ pension
and postretirement plans based on the adjustment of such liabilities to fair value.
(4) Represents an increase in depreciation and amortization expense resulting from the adjustment to Sears’
property and equipment and identifiable intangible assets based on the adjustment of such assets to fair
value.
(5) On November 15, 2005, the Company completed the sale of substantially all assets and liabilities of Sears
Canada’s Credit and Financial Services operations. Accordingly, the credit and financial product revenues
of $299 million and $381 million for the pro forma fiscal years ended 2005 and 2004, respectively, are not
expected to re-occur.
40