Rosetta Stone 2015 Annual Report Download - page 68
Download and view the complete annual report
Please find page 68 of the 2015 Rosetta Stone annual report below. You can navigate through the pages in the report by either clicking on the pages listed below, or by using the keyword search tool below to find specific information within the annual report.-
 1
1 -
2
-
3
-
4
-
5
-
6
-
7
-
8
-
9
-
10
-
11
-
12
-
13
-
14
-
15
-
16
-
17
-
18
-
19
-
20
-
21
-
22
-
23
-
24
-
25
-
26
-
27
-
28
-
29
-
30
-
31
-
32
-
33
-
34
-
35
-
36
-
37
-
38
-
39
-
40
-
41
-
42
-
43
-
44
-
45
-
46
-
47
-
48
-
49
-
50
-
51
-
52
-
53
-
54
-
55
-
56
-
57
-
 58
58 -
 59
59 -
 60
60 -
 61
61 -
 62
62 -
 63
63 -
 64
64 -
 65
65 -
 66
66 -
 67
67 -
 68
68 -
 69
69 -
 70
70 -
 71
71 -
 72
72 -
 73
73 -
 74
74 -
 75
75 -
 76
76 -
 77
77 -
 78
78 -
79
-
80
-
81
-
82
-
83
-
84
-
85
-
86
-
87
-
88
-
89
-
90
-
91
-
92
-
93
-
94
-
95
-
96
-
97
-
98
-
99
-
100
-
101
-
102
-
103
-
104
-
105
-
106
-
107
-
108
-
109
-
110
-
111
-
112
-
113
-
114
-
115
-
116
-
117
-
118
-
119
-
120
-
121
-
122
-
123
-
124
-
125
-
126
-
127
-
128
-
129
-
130
-
131
-
132
-
133
-
134
-
135
-
136
-
137
-
138
-
139
-
140
-
141
-
142
-
143
-
144
-
145
-
146
-
147
-
148
-
149
-
150
-
151
-
152
-
153
-
154
-
155
 |
 |

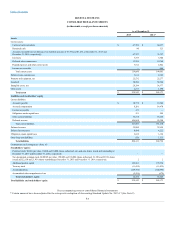
Table of Contents
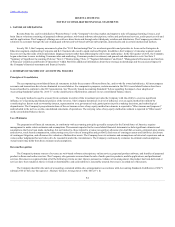
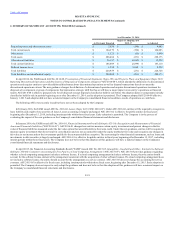
Inventories are stated at the lower of cost, determined on a first-in first-out basis, or market. The Company reviews inventory for excess quantities and
obsolescence based on its best estimates of future demand, product lifecycle status and product development plans. The Company uses historical information
along with these future estimates to establish a new cost basis for obsolete and potential obsolete inventory.
Accounts receivable and cash and cash equivalents subject the Company to its highest potential concentrations of credit risk. The Company reserves
for credit losses and does not require collateral on its trade accounts receivable. In addition, the Company maintains cash and investment balances in
accounts at various banks and brokerage firms. The Company has not experienced any losses on cash and cash equivalent accounts to date.
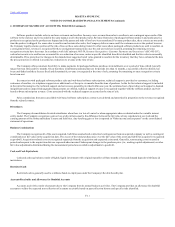
The Company sells its offerings to retailers, resellers, government agencies, and individual consumers and extends credit based on an evaluation of the
customer's financial condition, and may require collateral, such as letters of credit, in certain circumstances. Exposure to losses on receivables is principally
dependent on each customer's financial condition. The Company monitors its exposure for credit losses and maintains allowances for anticipated losses. No
customer accounted for more than 10% of the Company's revenue during the years ended December 31, 2015, 2014 or 2013. The four largest distributor and
reseller receivable balances collectively represented 30% and 33% of accounts receivable as of December 31, 2015 and 2014, respectively, with one
customer that accounted for 17% and 18% of accounts receivable as of December 31, 2015 and 2014, respectively. The Company maintains trade credit
insurance for certain customers to provide coverage, up to a certain limit, in the event of insolvency of some customers.
The Company values its assets and liabilities using the methods of fair value as described in ASC topic 820,
("ASC 820"). ASC 820 establishes a three-tier fair value hierarchy, which prioritizes the inputs used in measuring fair value. The three levels of
the fair value hierarchy are described below:
Level 1: Quoted prices for identical instruments in active markets.
Level 2: Quoted prices for similar instruments in active markets; quoted prices for identical or similar instruments in markets that are not active;
and model-derived valuations whose inputs are observable or whose significant value drivers are observable.
Level 3: Significant inputs to the valuation model are unobservable.
The carrying amounts reported in the consolidated balance sheets for cash and cash equivalents, restricted cash, accounts receivable, accounts payable
and other accrued expenses approximate fair value due to relatively short periods to maturity.
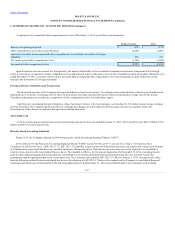
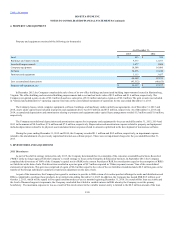
Property and equipment are stated at cost, less accumulated depreciation. Depreciation on property, leasehold improvements, equipment, and software
is computed on a straight-line basis over the estimated useful lives of the assets, as follows:
Software
3 years
Computer equipment
3-5 years
Automobiles
5 years
Furniture and equipment
5-7 years
Building
39 years
Building improvements
15 years
Leasehold improvements
lesser of lease term or economic life
Assets under capital leases
lesser of lease term or economic life
F-12