Rosetta Stone 2015 Annual Report Download - page 100
Download and view the complete annual report
Please find page 100 of the 2015 Rosetta Stone annual report below. You can navigate through the pages in the report by either clicking on the pages listed below, or by using the keyword search tool below to find specific information within the annual report.-
 1
1 -
2
-
3
-
4
-
5
-
6
-
7
-
8
-
9
-
10
-
11
-
12
-
13
-
14
-
15
-
16
-
17
-
18
-
19
-
20
-
21
-
22
-
23
-
24
-
25
-
26
-
27
-
28
-
29
-
30
-
31
-
32
-
33
-
34
-
35
-
36
-
37
-
38
-
39
-
40
-
41
-
42
-
43
-
44
-
45
-
46
-
47
-
48
-
49
-
50
-
51
-
52
-
53
-
54
-
55
-
56
-
57
-
58
-
59
-
60
-
61
-
62
-
63
-
64
-
65
-
66
-
67
-
68
-
69
-
70
-
71
-
72
-
73
-
74
-
75
-
76
-
77
-
78
-
79
-
80
-
81
-
82
-
83
-
84
-
85
-
86
-
87
-
88
-
89
-
 90
90 -
 91
91 -
 92
92 -
 93
93 -
 94
94 -
 95
95 -
 96
96 -
 97
97 -
 98
98 -
 99
99 -
 100
100 -
 101
101 -
 102
102 -
 103
103 -
 104
104 -
 105
105 -
 106
106 -
 107
107 -
 108
108 -
 109
109 -
 110
110 -
111
-
112
-
113
-
114
-
115
-
116
-
117
-
118
-
119
-
120
-
121
-
122
-
123
-
124
-
125
-
126
-
127
-
128
-
129
-
130
-
131
-
132
-
133
-
134
-
135
-
136
-
137
-
138
-
139
-
140
-
141
-
142
-
143
-
144
-
145
-
146
-
147
-
148
-
149
-
150
-
151
-
152
-
153
-
154
-
155
 |
 |

Table of Contents
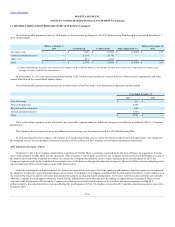
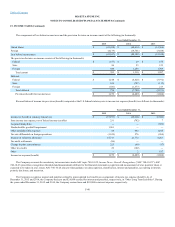
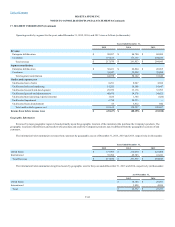
Operating results by segment for the years ended December 31, 2015, 2014, and 2013 were as follows (in thousands):
Enterprise & Education
$ 98,057
$ 84,700
$ 60,209
Consumer
119,613
177,153
204,436
Total revenue
$ 217,670
$ 261,853
$ 264,645
Enterprise & Education
$ 30,431
$ 22,864
$ 20,965
Consumer
34,547
35,298
70,884
Total segment contribution
64,978
58,162
91,849
Unallocated cost of sales
8,291
8,947
4,586
Unallocated sales and marketing
15,282
16,168
16,447
Unallocated research and development
29,939
33,176
33,993
Unallocated general and administrative
48,470
54,576
54,423
Unallocated non-operating expense/(income)
1,824
1,345
(424)
Unallocated impairment
6,754
20,333
—
Unallocated lease abandonment
55
3,812
842
Total unallocated expenses, net
110,615
138,357
109,867
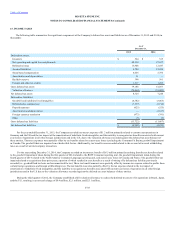
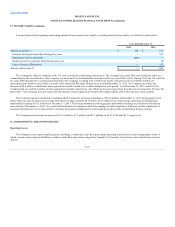
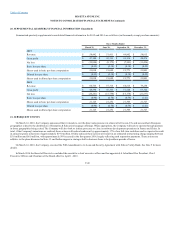
Geographic Information
Revenue by major geographic region is based primarily upon the geographic location of the customers who purchase the Company's products. The
geographic locations of distributors and resellers who purchase and resell the Company's products may be different from the geographic locations of end
customers.
The information below summarizes revenue from customers by geographic area as of December 31, 2015, 2014 and 2013, respectively (in thousands):
United States
$ 177,966
$ 212,070
$ 223,404
International
39,704
49,783
41,241
Total Revenue
$ 217,670
$ 261,853
$ 264,645
The information below summarizes long-lived assets by geographic area for the years ended December 31, 2015 and 2014, respectively (in thousands):
United States
$ 18,704
$ 20,451
International
3,828
4,826
Total
$ 22,532
$ 25,277
F-44