Rosetta Stone 2015 Annual Report Download - page 43
Download and view the complete annual report
Please find page 43 of the 2015 Rosetta Stone annual report below. You can navigate through the pages in the report by either clicking on the pages listed below, or by using the keyword search tool below to find specific information within the annual report.-
 1
1 -
2
-
3
-
4
-
5
-
6
-
7
-
8
-
9
-
10
-
11
-
12
-
13
-
14
-
15
-
16
-
17
-
18
-
19
-
20
-
21
-
22
-
23
-
24
-
25
-
26
-
27
-
28
-
29
-
30
-
31
-
32
-
 33
33 -
 34
34 -
 35
35 -
 36
36 -
 37
37 -
 38
38 -
 39
39 -
 40
40 -
 41
41 -
 42
42 -
 43
43 -
 44
44 -
 45
45 -
 46
46 -
 47
47 -
 48
48 -
 49
49 -
 50
50 -
 51
51 -
 52
52 -
 53
53 -
54
-
55
-
56
-
57
-
58
-
59
-
60
-
61
-
62
-
63
-
64
-
65
-
66
-
67
-
68
-
69
-
70
-
71
-
72
-
73
-
74
-
75
-
76
-
77
-
78
-
79
-
80
-
81
-
82
-
83
-
84
-
85
-
86
-
87
-
88
-
89
-
90
-
91
-
92
-
93
-
94
-
95
-
96
-
97
-
98
-
99
-
100
-
101
-
102
-
103
-
104
-
105
-
106
-
107
-
108
-
109
-
110
-
111
-
112
-
113
-
114
-
115
-
116
-
117
-
118
-
119
-
120
-
121
-
122
-
123
-
124
-
125
-
126
-
127
-
128
-
129
-
130
-
131
-
132
-
133
-
134
-
135
-
136
-
137
-
138
-
139
-
140
-
141
-
142
-
143
-
144
-
145
-
146
-
147
-
148
-
149
-
150
-
151
-
152
-
153
-
154
-
155
 |
 |

Table of Contents
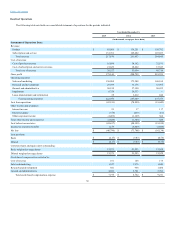
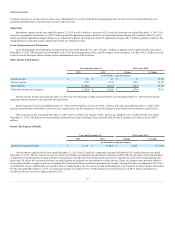
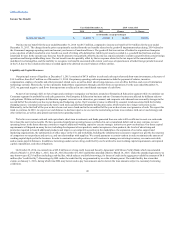
Our total revenue decreased to $261.9 million for the year ended December 31, 2014 from $264.6 million for the year ended December 31, 2013. The
change in total revenue was due to decreases in Consumer revenues of $27.3 million, partially offset by an increase in Enterprise & Education revenues of
$24.5 million.
We reported an operating loss of $78.9 million for the year ended December 31, 2014 compared to an operating loss of $18.4 million for the year ended
December 31, 2013. The increase in operating loss was due to a decrease in gross profit of $10.1 million, driven by a $2.8 million decrease in revenue and a
$7.3 million increase in cost of revenue. Operating expenses increased $50.3 million due to increases of $27.1 million in sales and marketing, $0.7 million in
general and administrative, $20.3 million in impairment expenses, and $3.0 million in lease abandonment, offset slightly by a decrease of $0.8 million in
research and development expenses.
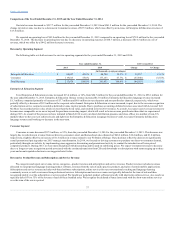
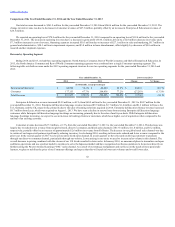
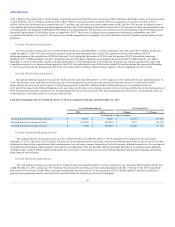
During 2014 and 2013, we had three operating segments: North America Consumer, Rest of World Consumer, and Global Enterprise & Education. In
2015, the North America Consumer and Rest of World Consumer operating segments were combined into a single Consumer operating segment. The
following table sets forth revenue under the 2015 operating segment structure for our two operating segments for the years ended December 31, 2014 and
2013:
Enterprise & Education
$ 84,700
32.3%
$ 60,209
22.8%
$ 24,491
40.7 %
Consumer
177,153
67.7%
204,436
77.2%
(27,283)
(13.3)%
Total Revenue
$ 261,853
100.0%
$ 264,645
100.0%
$ (2,792)
(1.1)%
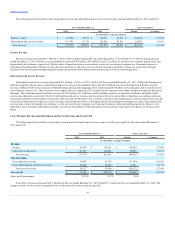
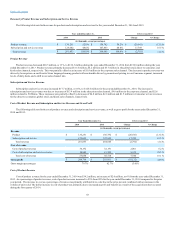
Enterprise & Education revenue increased $24.5 million, or 41%, from $60.2 million for the year ended December 31, 2013 to $84.7 million for the
year ended December 31, 2014. Enterprise & Education language revenue increased $9.9 million, $3.7 million, $1.4 million, and $1.2 million in France, the
U.S., Germany, and the UK, respectively, primarily due to the sales of learning solutions acquired in 2014. Enterprise & Education literacy revenue increased
$8.7 million from Lexia, which was acquired on August 1, 2013. We have seen a decline in renewal rates from existing Enterprise & Education language
customers while Enterprise & Education language bookings are increasing, primarily due to the sales of multi-year deals. With Enterprise & Education
language bookings increasing, we expect to see an increase in bookings from new customers, which has a higher cost of acquisition when compared to the
renewal of an existing customer.
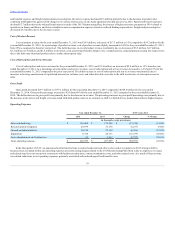
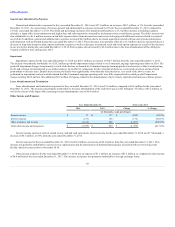
Consumer revenue decreased $27.3 million, or 13%, from the year ended December 31, 2013 to the year ended December 31, 2014. This decrease was
largely due to reductions in revenue from our global retail, direct-to-consumer, and kiosk sales channels of $13.8 million, $11.0 million, and $5.2 million,
respectively; partially offset by an increase of approximately $2.6 million in revenue from Fit Brains. The decrease in our global retail sales channel was due
to certain of our larger retail partners significantly reducing inventory levels during 2014, resulting in fewer units ordered and lower revenue compared to the
prior year. In the second quarter of 2013 we closed our entire kiosk sales channel. In recent quarters we have focused on driving customers to purchase
through our direct-to-consumer channel, particularly through our website. Lower pricing is one tactic we used to increase sales volume in this channel. The
overall decrease in pricing combined with the closure of our U.S. kiosks resulted in lower sales. In January 2014, we announced plans to streamline our Japan
and Korea operations and use a partner model to continue to serve the Japanese market and have reorganized our Korea operations to focus more directly on
further scaling the Proctor Assisted Learning (“PAL”) sales channel. As a result of our strategic realignment and our focus on the needs of more passionate
learners, we plan to stabilize the price of our Consumer offerings and expect that this will result in lower unit volumes and overall lower sales.
42