Rosetta Stone 2015 Annual Report Download - page 40
Download and view the complete annual report
Please find page 40 of the 2015 Rosetta Stone annual report below. You can navigate through the pages in the report by either clicking on the pages listed below, or by using the keyword search tool below to find specific information within the annual report.-
 1
1 -
2
-
3
-
4
-
5
-
6
-
7
-
8
-
9
-
10
-
11
-
12
-
13
-
14
-
15
-
16
-
17
-
18
-
19
-
20
-
21
-
22
-
23
-
24
-
25
-
26
-
27
-
28
-
29
-
 30
30 -
 31
31 -
 32
32 -
 33
33 -
 34
34 -
 35
35 -
 36
36 -
 37
37 -
 38
38 -
 39
39 -
 40
40 -
 41
41 -
 42
42 -
 43
43 -
 44
44 -
 45
45 -
 46
46 -
 47
47 -
 48
48 -
 49
49 -
 50
50 -
51
-
52
-
53
-
54
-
55
-
56
-
57
-
58
-
59
-
60
-
61
-
62
-
63
-
64
-
65
-
66
-
67
-
68
-
69
-
70
-
71
-
72
-
73
-
74
-
75
-
76
-
77
-
78
-
79
-
80
-
81
-
82
-
83
-
84
-
85
-
86
-
87
-
88
-
89
-
90
-
91
-
92
-
93
-
94
-
95
-
96
-
97
-
98
-
99
-
100
-
101
-
102
-
103
-
104
-
105
-
106
-
107
-
108
-
109
-
110
-
111
-
112
-
113
-
114
-
115
-
116
-
117
-
118
-
119
-
120
-
121
-
122
-
123
-
124
-
125
-
126
-
127
-
128
-
129
-
130
-
131
-
132
-
133
-
134
-
135
-
136
-
137
-
138
-
139
-
140
-
141
-
142
-
143
-
144
-
145
-
146
-
147
-
148
-
149
-
150
-
151
-
152
-
153
-
154
-
155
 |
 |

Table of Contents
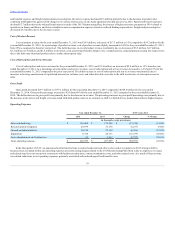
and benefits expense, and freight and payment processing fees. Inventory expense declined $6.3 million primarily due to the decrease in product sales
combined with higher first quarter 2014 charges to inventory obsolescence in our Asian operations that did not recur in 2015. Payroll and benefit expenses
declined $3.7 million driven by reduced headcount as a result of the 2015 Restructuring Plan, the absence of higher severance payments in 2014 related to
operations in France and Korea, and lower variable incentive compensation expenses based on reduced funding expectations. Freight and processing fees
decreased $3.5 million due to the decrease in sales.
Cost of Product Revenue
Cost of product revenue for the year ended December 31, 2015 was $16.9 million, a decrease of $17.3 million or 51% compared to $34.2 million for the
year ended December 31, 2014. As a percentage of product revenue, cost of product revenue slightly increased to 26% for the year ended December 31, 2015
from 25% as compared to the prior year period. The dollar decrease in cost of product revenue is primarily due to decreases of $5.5 million, $4.7 million,
$2.2 million, $1.6 million, and $1.2 million in inventory costs, payroll and benefits, freight costs, commission fees, and payment processing fees respectively,
due to the shift away from hard product sales to online subscription sales.
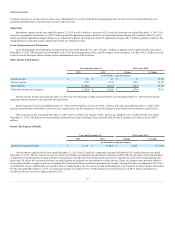
Cost of Subscription and Service Revenue
Cost of subscription and service revenue for the year ended December 31, 2015 was $21.6 million, an increase of $2.8 million, or 15% from the year
ended December 31, 2014. As a percentage of subscription and service revenue, cost of subscription and service revenue decreased to 14% from 15% for the
year ended December 31, 2015 compared to the prior year period. The dollar increase in cost of subscription and service revenue was primarily due to
increases in hosting, amortization of capitalized internal-use software costs, and other allocable costs due to the shift in sales mix to subscription service
sales.
Gross Profit
Gross profit decreased $29.7 million to $179.1 million for the year ended December 31, 2015 compared to $208.8 million for the year ended
December 31, 2014. Gross profit percentage increased to 82% from 80% for the year ended December 31, 2015 compared to the year ended December 31,
2014. The dollar decrease in gross profit was primarily due to the decrease in revenue. The percentage increase in gross profit percentage was primarily due to
the decrease in inventory and freight costs associated with hard product sales as we continue to shift to a SaaS delivery model which attracts higher margins.
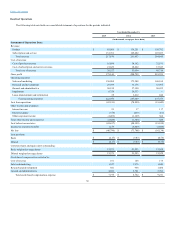
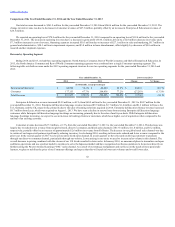
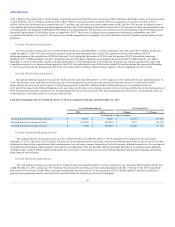
Sales and marketing
$ 136,084
$ 173,208
$ (37,124)
(21.4)%
Research and development
29,939
33,176
(3,237)
(9.8)%
General and administrative
50,124
57,120
(6,996)
(12.2)%
Impairment
6,754
20,333
(13,579)
(66.8)%
Lease abandonment and termination
55
3,812
(3,757)
(98.6)%
Total operating expenses
$ 222,956
$ 287,649
$ (64,693)
(22.5)%
In the first quarter of 2015, we announced and initiated actions to reduce headcount and other costs in order to support our 2015 strategic shift in
business focus. Included within our operating expenses are restructuring charges related to the 2015 Restructuring Plan which relate to employee severance
and related benefits costs incurred in connection with headcount reductions, contract termination costs, and other related costs. As a result of these actions,
we realized reductions in our operating expenses, primarily associated with reduced payroll and benefits costs.
39