Rosetta Stone 2015 Annual Report Download - page 45
Download and view the complete annual report
Please find page 45 of the 2015 Rosetta Stone annual report below. You can navigate through the pages in the report by either clicking on the pages listed below, or by using the keyword search tool below to find specific information within the annual report.-
 1
1 -
2
-
3
-
4
-
5
-
6
-
7
-
8
-
9
-
10
-
11
-
12
-
13
-
14
-
15
-
16
-
17
-
18
-
19
-
20
-
21
-
22
-
23
-
24
-
25
-
26
-
27
-
28
-
29
-
30
-
31
-
32
-
33
-
34
-
 35
35 -
 36
36 -
 37
37 -
 38
38 -
 39
39 -
 40
40 -
 41
41 -
 42
42 -
 43
43 -
 44
44 -
 45
45 -
 46
46 -
 47
47 -
 48
48 -
 49
49 -
 50
50 -
 51
51 -
 52
52 -
 53
53 -
 54
54 -
 55
55 -
56
-
57
-
58
-
59
-
60
-
61
-
62
-
63
-
64
-
65
-
66
-
67
-
68
-
69
-
70
-
71
-
72
-
73
-
74
-
75
-
76
-
77
-
78
-
79
-
80
-
81
-
82
-
83
-
84
-
85
-
86
-
87
-
88
-
89
-
90
-
91
-
92
-
93
-
94
-
95
-
96
-
97
-
98
-
99
-
100
-
101
-
102
-
103
-
104
-
105
-
106
-
107
-
108
-
109
-
110
-
111
-
112
-
113
-
114
-
115
-
116
-
117
-
118
-
119
-
120
-
121
-
122
-
123
-
124
-
125
-
126
-
127
-
128
-
129
-
130
-
131
-
132
-
133
-
134
-
135
-
136
-
137
-
138
-
139
-
140
-
141
-
142
-
143
-
144
-
145
-
146
-
147
-
148
-
149
-
150
-
151
-
152
-
153
-
154
-
155
 |
 |

Table of Contents
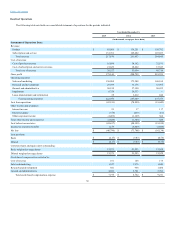
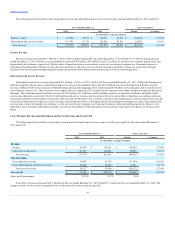
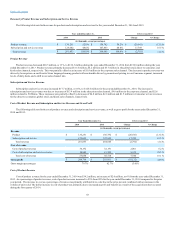
Cost of Subscription and Service Revenue
Cost of subscription and service revenue for the year ended December 31, 2014 was $18.9 million, an increase of $5.3 million, or 39% from the year
ended December 31, 2013. As a percentage of subscription and service revenue, cost of subscription and service revenue increased to 15% from 13% for the
year ended December 31, 2014 compared to the prior year period. The dollar increase in cost of subscription and service revenue was due to increased payroll
and benefits, primarily as a result of the acquisitions that occurred during the first quarter of 2014 and second and third quarters of 2013. There was an
increase in hosting expense due to the support of additional companies and a transition to cloud-based platforms. An increase in depreciation and
amortization on acquired intangible assets also contributed to the overall increase in cost of subscription and service revenue.
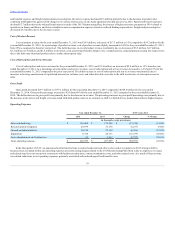
Sales and marketing
$ 173,208
$ 146,104
$ 27,104
18.6 %
Research and development
33,176
33,995
(819)
(2.4)%
General and administrative
57,120
56,432
688
1.2 %
Impairment
20,333
—
20,333
100.0 %
Lease abandonment and termination
3,812
842
2,970
352.7 %
Total operating expenses
$ 287,649
$ 237,373
$ 50,276
21.2 %
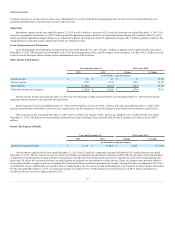
Sales and Marketing Expenses
Sales and marketing expenses for the year ended December 31, 2014 were $173.2 million, an increase of $27.1 million, or 19%, from the year ended
December 31, 2013. As a percentage of total revenue, sales and marketing expenses were 66% for the year ended December 31, 2014, and 55% for the year
ended December 31, 2013. The dollar and percentage increases in sales and marketing expenses were primarily attributable to a $11.0 million increase in
media expense due to increased Internet and social media marketing campaigns, partially offset by decreased spend in television and print as online
marketing was determined to be more cost-effective. Increased marketing expenses of $4.9 million related to the "millennial" advertising campaign using
newly developed creative which runs across television, videos and our website, the new 2014 online chat support services feature, and an increase in general
media expenses to drive visits, leads and bookings. In 2014 there was a $5.4 million increase in payroll and a $1.6 million increase in benefits expenses as a
result of our acquisitions. In addition, there was a $5.5 million increase in commission expense mainly driven from the increased sales in the Enterprise &
Education segment, slightly offset by a decrease in commission expense for the Consumer segment. There was a $1.5 million increase in third party services
driven from new social media monitoring services, increased email messaging and related overage fees. Additionally, there was a $2.0 million increase in
depreciation and amortization on acquired intangible assets. These increases were partially offset by a $2.3 million decrease in professional services driven
from decreased spend in call centers, $1.9 million decrease in rent and related lease termination expenses due to the closure of the remaining kiosks in the
second quarter of 2013, and removal of kiosk staffing support that did not recur in 2014.
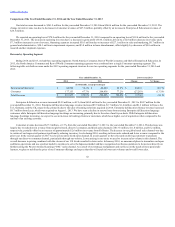
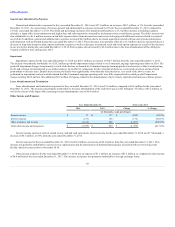
Research and Development Expenses
Research and development expenses were $33.2 million for the year ended December 31, 2014, a decrease of $0.8 million, or 2%, from the year ended
December 31, 2013. As a percentage of revenue, research and development expenses remained flat at 13% for the years ended December 31, 2014 and 2013.
The dollar decrease was primarily attributable to a $2.9 million decrease in payroll expense due to the increased level of capitalized labor costs associated
with the development of new service offerings and a decrease in severance compensation expenses driven from the software development team re-
organization during the year ended December 31, 2013. An additional $0.5 million decrease of research and development expenses was driven from the
reduction of relocation expense related to the hiring of a new software development team in 2013. These decreases were partially offset by a $0.7 million
increase in benefits due to the additional employee costs as a result of the acquisitions, a $1.5 million increase in amortization expense related to acquired
intangible assets, and a $0.5 million increase in rent expense due to the opening of new offices in Austin, TX and San Francisco, CA, and taking over leases
through acquisitions in various locations, including Seattle, WA and Concord, MA.
44