Rosetta Stone 2015 Annual Report Download - page 49
Download and view the complete annual report
Please find page 49 of the 2015 Rosetta Stone annual report below. You can navigate through the pages in the report by either clicking on the pages listed below, or by using the keyword search tool below to find specific information within the annual report.-
 1
1 -
2
-
3
-
4
-
5
-
6
-
7
-
8
-
9
-
10
-
11
-
12
-
13
-
14
-
15
-
16
-
17
-
18
-
19
-
20
-
21
-
22
-
23
-
24
-
25
-
26
-
27
-
28
-
29
-
30
-
31
-
32
-
33
-
34
-
35
-
36
-
37
-
38
-
 39
39 -
 40
40 -
 41
41 -
 42
42 -
 43
43 -
 44
44 -
 45
45 -
 46
46 -
 47
47 -
 48
48 -
 49
49 -
 50
50 -
 51
51 -
 52
52 -
 53
53 -
 54
54 -
 55
55 -
 56
56 -
 57
57 -
 58
58 -
 59
59 -
60
-
61
-
62
-
63
-
64
-
65
-
66
-
67
-
68
-
69
-
70
-
71
-
72
-
73
-
74
-
75
-
76
-
77
-
78
-
79
-
80
-
81
-
82
-
83
-
84
-
85
-
86
-
87
-
88
-
89
-
90
-
91
-
92
-
93
-
94
-
95
-
96
-
97
-
98
-
99
-
100
-
101
-
102
-
103
-
104
-
105
-
106
-
107
-
108
-
109
-
110
-
111
-
112
-
113
-
114
-
115
-
116
-
117
-
118
-
119
-
120
-
121
-
122
-
123
-
124
-
125
-
126
-
127
-
128
-
129
-
130
-
131
-
132
-
133
-
134
-
135
-
136
-
137
-
138
-
139
-
140
-
141
-
142
-
143
-
144
-
145
-
146
-
147
-
148
-
149
-
150
-
151
-
152
-
153
-
154
-
155
 |
 |

Table of Contents
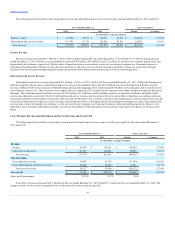
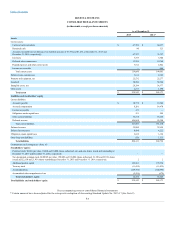
of $7.7 million. The primary drivers of the change in operating assets and liabilities were an increase of $48.9 million in deferred revenue, an increase in other
current liabilities of $11.3 million, and an increase of $8.4 million in accounts payable, partially offset by an increase in accounts receivable of $16.5
million, an increase in deferred sales commissions of $7.3 million, and a decrease in accrued compensation of $4.5 million. The increase in deferred revenue
was primarily due to the purchase accounting impacts related to the 2014 acquisitions that did not exist in 2013. The increases in other current liabilities and
accounts payable was primarily attributable to the timing of our cash payments. The increase in accounts receivable was primarily related to the higher sales
during the fourth quarter 2014 holiday season as compared to 2013. The increase in deferred sales commission was primarily attributable to the 2014
acquisitions that did not exist in 2013. The decrease in accrued compensation was primarily due to the reduction of payroll, benefits, and the timing of cash
payments.
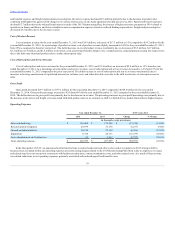
Net cash used in investing activities was $9.4 million for the year ended December 31, 2015, compared to net cash used of $39.1 million for the year
ended December 31, 2014. Net cash used in investing activities decreased primarily due to the 2014 acquisition related cash outflows of $29.4
million pertaining to the acquisitions of Tell Me More and Vivity during the first quarter of 2014. In the first quarter of 2015, we paid the remaining
holdback of $1.7 million related to the 2013 acquisition of Lexia. Purchases of property and equipment decreased from $9.7 million for the year ended
December 31, 2014 to $8.9 million for the year ended December 31, 2015 primarily due to the reduction of internal-use software capitalization due to the
completion and go-live of a major software project in late 2015. Proceeds from the sale of fixed assets totaled $1.6 million during the year ended December
31, 2015 associated with the fourth quarter 2015 sale of an owned office building in Harrisonburg, Virginia, with no comparable activity in 2014.
Net cash used in financing activities was $0.7 million for the year ended December 31, 2015 compared to $0.3 million for the year ended December 31,
2014. The decrease in net cash related to financing activities was primarily due to the decrease in proceeds from the exercise of stock options of $0.6
million due to the decrease in our stock price. Capital lease payments totaled $0.7 million and $0.6 million during the years ended December 31,
2015 and 2014, respectively. Deferred financing costs were larger in 2014 due to the original execution of the revolving credit facility in the fourth quarter of
2014. Deferred financing fees continued to be incurred during 2015 due to the execution of the four amendments discussed above. As mentioned earlier, no
borrowings have been made under the revolving credit facility.
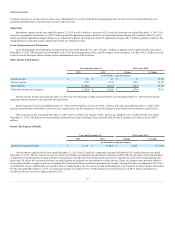
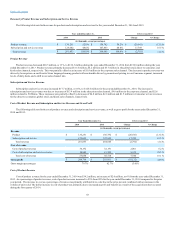
Cash Flow Analysis for the Year ended December 31, 2014 as compared to the year ended December 31, 2013
Net cash provided by operating activities
$ 6,673
$ 8,068
$ (1,395)
(17.3)%
Net cash used in investing activities
$ (39,109)
$ (46,930)
$ 7,821
(16.7)%
Net cash used in financing activities
$ (305)
$ (10,487)
$ 10,182
(97.1)%
Net cash provided by operating activities was $6.7 million for the year ended December 31, 2014 compared to $8.1 million for the year ended
December 31, 2013, a decrease of $1.4 million. The decrease in net cash provided by operating activities was primarily due to an increase in our net loss after
adjusting for depreciation, amortization, stock compensation, loss on foreign currency transactions, bad debt expense, deferred income taxes, loss on disposal
of equipment, amortization of debt issuance costs, and loss on impairment. This was partially offset by favorable fluctuations in working capital, primarily
deferred revenue of $48.9 million which is principally due to the sales of subscription services in our Global Enterprise & Education language and literacy
sales channels and Fit Brains.
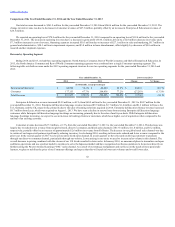
Net cash used in investing activities was $39.1 million for the year ended December 31, 2014, compared to net cash used of $46.9 million for the year
ended December 31, 2013, a decrease of $7.8 million. Net cash used by investing activities related primarily to the $41.7 million for the 2014 acquisitions
(net of cash) of Vivity and Tell Me More, a decrease in restricted cash related to the Vivity acquisition of $12.3 million, and $9.7 million in purchase of
property and equipment primarily associated with capitalized labor for internal-use software development.
48