Rosetta Stone 2015 Annual Report Download - page 29
Download and view the complete annual report
Please find page 29 of the 2015 Rosetta Stone annual report below. You can navigate through the pages in the report by either clicking on the pages listed below, or by using the keyword search tool below to find specific information within the annual report.-
 1
1 -
2
-
3
-
4
-
5
-
6
-
7
-
8
-
9
-
10
-
11
-
12
-
13
-
14
-
15
-
16
-
17
-
18
-
 19
19 -
 20
20 -
 21
21 -
 22
22 -
 23
23 -
 24
24 -
 25
25 -
 26
26 -
 27
27 -
 28
28 -
 29
29 -
 30
30 -
 31
31 -
 32
32 -
 33
33 -
 34
34 -
 35
35 -
 36
36 -
 37
37 -
 38
38 -
 39
39 -
40
-
41
-
42
-
43
-
44
-
45
-
46
-
47
-
48
-
49
-
50
-
51
-
52
-
53
-
54
-
55
-
56
-
57
-
58
-
59
-
60
-
61
-
62
-
63
-
64
-
65
-
66
-
67
-
68
-
69
-
70
-
71
-
72
-
73
-
74
-
75
-
76
-
77
-
78
-
79
-
80
-
81
-
82
-
83
-
84
-
85
-
86
-
87
-
88
-
89
-
90
-
91
-
92
-
93
-
94
-
95
-
96
-
97
-
98
-
99
-
100
-
101
-
102
-
103
-
104
-
105
-
106
-
107
-
108
-
109
-
110
-
111
-
112
-
113
-
114
-
115
-
116
-
117
-
118
-
119
-
120
-
121
-
122
-
123
-
124
-
125
-
126
-
127
-
128
-
129
-
130
-
131
-
132
-
133
-
134
-
135
-
136
-
137
-
138
-
139
-
140
-
141
-
142
-
143
-
144
-
145
-
146
-
147
-
148
-
149
-
150
-
151
-
152
-
153
-
154
-
155
 |
 |

Table of Contents
◦ right sizing our Enterprise & Education segment to target those geographies and customer segments where we have the greatest opportunity;
and
◦ reducing our general and administrative costs.
In pursuing these priorities, we will (i) allocate capital to the areas of our business that we believe have the greatest growth potential, including our
literacy-learning business, (ii) focus our businesses on their best customers, including Corporate and K-12 learners primarily in North America and Northern
Europe in our Enterprise & Education language business and passionate learners in the United States and select non-US markets in our Consumer language
business, and (iii) optimize the sales and marketing costs for these businesses and the costs of our business overall.
In March 2015, we initiated a plan (the "2015 Restructuring Plan") to make reductions to Consumer sales and marketing, Consumer product
investment, and general and administrative costs. We expect to realize annualized cost savings of approximately $65 million as a result of these actions. Our
results of operations reflect the impact of these cost reductions as well as additional cost savings and employee reductions that have occurred outside of the
2015 Restructuring Plan. We expect overall profitability within the Consumer segment to mitigate as we expect these costs savings to offset expected
revenue declines in the Consumer segment. See Note 2 and Note 13 of Item 8, for additional information
about these strategic undertakings. In addition, Stephen M. Swad, who served as our President and Chief Executive Officer throughout 2014, resigned from
this position effective April 1, 2015. The Board of Directors appointed A. John Hass III to serve as Interim President and Chief Executive Officer, also
effective April 1, 2015, while the Company engaged in a search for a chief executive officer. In March 2016, the Board of Director's concluded the search and
appointed A. John Hass III as President, Chief Executive Officer, and Chairman of the Board effective April 1, 2016. In conjunction with the 2015
Restructuring Plan, outside financial and legal advisors were retained to assist management and the Board of Directors with their ongoing comprehensive
review to analyze potential options to improve financial performance and enhance shareholder value.
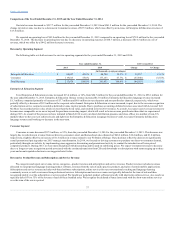
We currently have two operating segments: Enterprise & Education and Consumer, rather than the three operating segments (Global Enterprise &
Education, North America Consumer, and Rest of World Consumer) we had as of December 31, 2014 and 2013. We discuss the profitability of each segment
in terms of segment contribution. Segment contribution is the measure of profitability used by our Chief Operating Decision Maker. Segment contribution
includes segment revenue and expenses incurred directly by the segment, including material costs, service costs, customer care and coaching costs, sales and
marketing expense and bad debt expense.
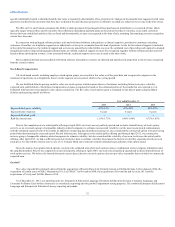
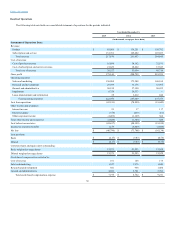
For the year ended December 31, 2015, Enterprise & Education segment contribution increased to $30.4 million with a segment contribution margin of
31%, compared to $22.9 million with a segment contribution margin of 27% for the year ended December 31, 2014. The dollar and margin increases were
primarily due to the increase in Enterprise & Education revenue which was slightly offset by an increase in direct sales related expenses. Consumer segment
contribution decreased to $34.5 million with a contribution margin of 29% for the year ended December 31, 2015 from $35.3 million with a contribution
margin of 20% for the year ended December 31, 2014. The dollar decrease in Consumer segment contribution was primarily due to a decrease in Consumer
revenue of $57.5 million, almost entirely offset by cost reductions. The Consumer segment contribution margin increased due to our cost reduction
initiatives.
For the year ended December 31, 2014, Enterprise & Education segment contribution increased slightly to $22.9 million with a segment contribution
margin of 27%, compared to $21.0 million with a segment contribution margin of 35% for the year ended December 31, 2013. The dollar increase was
primarily due to the increase in Enterprise & Education revenue while the decrease in margin was due to the lower margin on our acquired service offerings.
Consumer segment contribution decreased to $35.3 million with a contribution margin of 20% for the year ended December 31, 2014 from $70.9 million
with a contribution margin of 35% for the year ended December 31, 2013. The dollar and margin decrease in Consumer segment contribution was primarily
due to a decrease in retail and direct-to-consumer revenues and the reduction of international operations.
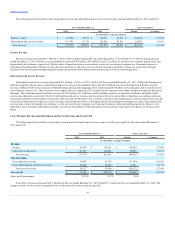
Over the last few years, our Consumer strategy has been to shift more and more of our Consumer business to web-based software subscriptions, digital
downloads and mobile applications and away from perpetual CD packages. We believe that these formats provide customers with an overall improved
experience and the flexibility to use our products on multiple platforms (i.e., tablets and mobile phones). We believe these platforms also serve more
economical and relevant ways for us to deliver our products to customers. One challenge to encouraging customers to enter into or renew a subscription
arrangement is that usage of our product varies greatly, ranging from customers that purchase but do not have any usage to customers with high usage. The
majority of purchasers tend towards the lower end of that spectrum, with most usage coming in the first few months after purchase and declining over time -
similar to a gym membership.
28