Rosetta Stone 2015 Annual Report Download - page 39
Download and view the complete annual report
Please find page 39 of the 2015 Rosetta Stone annual report below. You can navigate through the pages in the report by either clicking on the pages listed below, or by using the keyword search tool below to find specific information within the annual report.-
 1
1 -
2
-
3
-
4
-
5
-
6
-
7
-
8
-
9
-
10
-
11
-
12
-
13
-
14
-
15
-
16
-
17
-
18
-
19
-
20
-
21
-
22
-
23
-
24
-
25
-
26
-
27
-
28
-
 29
29 -
 30
30 -
 31
31 -
 32
32 -
 33
33 -
 34
34 -
 35
35 -
 36
36 -
 37
37 -
 38
38 -
 39
39 -
 40
40 -
 41
41 -
 42
42 -
 43
43 -
 44
44 -
 45
45 -
 46
46 -
 47
47 -
 48
48 -
 49
49 -
50
-
51
-
52
-
53
-
54
-
55
-
56
-
57
-
58
-
59
-
60
-
61
-
62
-
63
-
64
-
65
-
66
-
67
-
68
-
69
-
70
-
71
-
72
-
73
-
74
-
75
-
76
-
77
-
78
-
79
-
80
-
81
-
82
-
83
-
84
-
85
-
86
-
87
-
88
-
89
-
90
-
91
-
92
-
93
-
94
-
95
-
96
-
97
-
98
-
99
-
100
-
101
-
102
-
103
-
104
-
105
-
106
-
107
-
108
-
109
-
110
-
111
-
112
-
113
-
114
-
115
-
116
-
117
-
118
-
119
-
120
-
121
-
122
-
123
-
124
-
125
-
126
-
127
-
128
-
129
-
130
-
131
-
132
-
133
-
134
-
135
-
136
-
137
-
138
-
139
-
140
-
141
-
142
-
143
-
144
-
145
-
146
-
147
-
148
-
149
-
150
-
151
-
152
-
153
-
154
-
155
 |
 |

Table of Contents
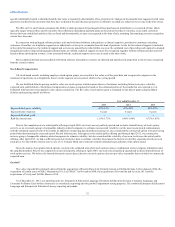
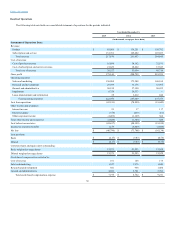
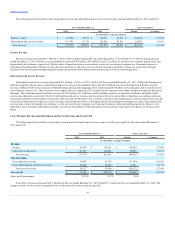
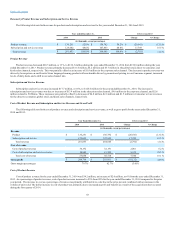
The following table sets forth revenue for product revenue and subscription and service revenue for the years ended December 31, 2015 and 2014:
Product revenue
$ 65,969
30.3%
$ 136,251
52.0%
$ (70,282)
(51.6)%
Subscription and service revenue
151,701
69.7%
125,602
48.0%
26,099
20.8 %
Total revenue
$ 217,670
100.0%
$ 261,853
100.0%
$ (44,183)
(16.9)%
Product Revenue
Product revenue decreased $70.3 million, or 52%, to $66.0 million during the year ended December 31, 2015 from $136.3 million during the year
ended December 31, 2014. Product revenue primarily decreased $58.6 million, $9.8 million, and $1.2 million in our direct-to-consumer, global retail, and
homeschool sales channels, respectively. Product sales volume decreased as we continue to carry out our strategy to migrate our Consumer business to
subscription-based products. Product revenue also decreased due to the year-over-year decline in product unit sales volume as a result of the strategic
decision to be more disciplined marketing and advertising expenses and curtail promotional pricing to focus on stabilizing prices.
Subscription and Service Revenue
Subscription and service revenue increased $26.1 million, or 21%, to $151.7 million for the year ended December 31, 2015. Within the Enterprise &
Education segment, the increase in subscription and service revenue was primarily due to the $12.0 million increase in Enterprise & Education literacy
revenue combined with revenue increases within Enterprise & Education language of $3.2 million and $0.9 million in the education and non-profit service
sales channels, respectively. These increases were slightly offset by a decrease of $2.1 million in the corporate sales channel within Enterprise & Education
language. The Consumer segment realized increases of $10.5 million, $1.6 million, and $0.4 million in direct-to-consumer, Fit Brains, and global retail
service sales channels, respectively. Our 2014 subscription and service revenue was lower due to the write-down effects of purchase accounting on the pre-
acquisition deferred revenue balances associated with Lexia and Tell Me More. We continue to experience these purchase accounting impacts for Lexia due
to the typical subscription length. As a result, we expect the growth rates from our Enterprise & Education segment to mitigate over time. Subscription and
services sales volume increased as we continue to carry out our strategy to migrate our Consumer business to subscription-based products. However, it is
important to note that these subscribers generally only stay for the duration of the subscription period, which could negatively impact our revenue in the
future.
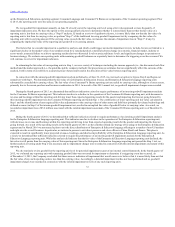
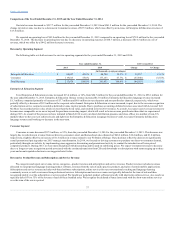
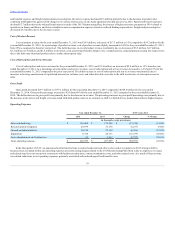
The following table sets forth cost of product revenue and subscription and service revenue, as well as gross profit for the years ended December 31,
2015 and 2014:
Product
$ 65,969
$ 136,251
$ (70,282)
(51.6)%
Subscription and service
151,701
125,602
26,099
20.8 %
Total revenue
217,670
261,853
(44,183)
(16.9)%
Cost of product revenue
16,898
34,192
(17,294)
(50.6)%
Cost of subscription and service revenue
21,629
18,862
2,767
14.7 %
Total cost of revenue
38,527
53,054
(14,527)
(27.4)%
$ 179,143
$ 208,799
$ (29,656)
(14.2)%
Gross profit percentages
82.3%
79.7%
2.6%
Total cost of revenue decreased $14.5 million for the year ended December 31, 2015 from $53.1 million for the year ended December 31, 2014. The
change in total cost of revenue was primarily due to decreases in inventory expense, payroll
38