Rosetta Stone 2015 Annual Report Download - page 48
Download and view the complete annual report
Please find page 48 of the 2015 Rosetta Stone annual report below. You can navigate through the pages in the report by either clicking on the pages listed below, or by using the keyword search tool below to find specific information within the annual report.-
 1
1 -
2
-
3
-
4
-
5
-
6
-
7
-
8
-
9
-
10
-
11
-
12
-
13
-
14
-
15
-
16
-
17
-
18
-
19
-
20
-
21
-
22
-
23
-
24
-
25
-
26
-
27
-
28
-
29
-
30
-
31
-
32
-
33
-
34
-
35
-
36
-
37
-
 38
38 -
 39
39 -
 40
40 -
 41
41 -
 42
42 -
 43
43 -
 44
44 -
 45
45 -
 46
46 -
 47
47 -
 48
48 -
 49
49 -
 50
50 -
 51
51 -
 52
52 -
 53
53 -
 54
54 -
 55
55 -
 56
56 -
 57
57 -
 58
58 -
59
-
60
-
61
-
62
-
63
-
64
-
65
-
66
-
67
-
68
-
69
-
70
-
71
-
72
-
73
-
74
-
75
-
76
-
77
-
78
-
79
-
80
-
81
-
82
-
83
-
84
-
85
-
86
-
87
-
88
-
89
-
90
-
91
-
92
-
93
-
94
-
95
-
96
-
97
-
98
-
99
-
100
-
101
-
102
-
103
-
104
-
105
-
106
-
107
-
108
-
109
-
110
-
111
-
112
-
113
-
114
-
115
-
116
-
117
-
118
-
119
-
120
-
121
-
122
-
123
-
124
-
125
-
126
-
127
-
128
-
129
-
130
-
131
-
132
-
133
-
134
-
135
-
136
-
137
-
138
-
139
-
140
-
141
-
142
-
143
-
144
-
145
-
146
-
147
-
148
-
149
-
150
-
151
-
152
-
153
-
154
-
155
 |
 |

Table of Contents
The total obligations under the credit facility cannot exceed the lesser of (i) the total revolving commitment of $25.0 million or (ii) the borrowing base,
which is calculated as 80% of eligible accounts receivable. As a result, the borrowing base will fluctuate and we expect it will follow the general seasonality
of cash and accounts receivable (lower in the first half of the year and higher in the second half of the year). If the borrowing base less any outstanding
amounts, plus the cash held at SVB ("Availability") is greater than $25.0 million, then we may borrow up to an additional $5.0 million, but in no case can
borrowings exceed $25.0 million. Interest on borrowings accrue at the Prime Rate provided that we maintain a minimum cash and Availability balance of
$17.5 million. If cash and Availability is below $17.5 million, interest will accrue at the Prime Rate plus 1%.
As of the date of this filing, no borrowings have been made under the revolving credit agreement and $4.0 million in letters of credit have been issued
by Silicon Valley Bank on our behalf. We are subject to certain financial and restrictive covenants under the credit facility, which have been amended to
reflect the revised outlook in connection with our 2016 Restructuring Plan. We are required to maintain compliance with a minimum liquidity amount and
minimum financial performance requirements, as defined in the Loan and Security Agreement. As of December 31, 2015, we were in compliance with all of
the covenants under the revolving credit agreement.
The total amount of cash that was held by foreign subsidiaries as of December 31, 2015 was $15.6 million. If we were to repatriate the cash from our
foreign subsidiaries, a significant tax liability could result.
During the last three years, inflation has not had a material effect on our business and we do not expect that inflation or changing prices will materially
affect our business in the foreseeable future.
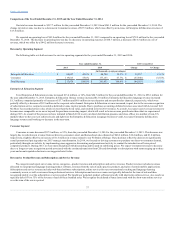
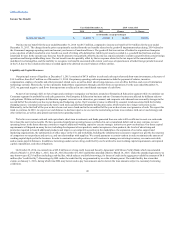
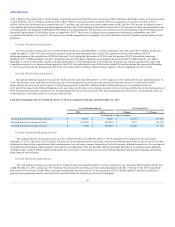
Cash Flow Analysis for the Year ended December 31, 2015 as compared to the year ended December 31, 2014
Net cash (used in) provided by operating activities
$ (5,645)
$ 6,673
$ (12,318)
(184.6)%
Net cash used in investing activities
$ (9,374)
$ (39,109)
$ 29,735
(76.0)%
Net cash used in financing activities
$ (727)
$ (305)
$ (422)
138.4 %
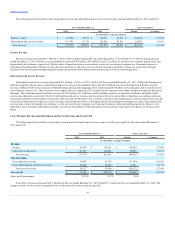
Net cash used in operating activities was $5.6 million for the year ended December 31, 2015 compared to net cash provided by operating activities of
$6.7 million for the year ended December 31, 2014. The primary factor affecting our net use of cash from operating activities during the year ended December
31, 2015 was our net loss of $46.8 million, which was too large to be offset by the non-cash adjustments totaling $31.1 million and the favorable overall
change in operating assets and liabilities of $10.1 million. For a summary of the factors that led to the net loss for the year ended December 31, 2015 see
"Results of Operations" section above. Non-cash items primarily consisted of $13.7 million in depreciation and amortization expense, $7.2 million in stock-
based compensation expense, $6.8 million in impairment loss, $1.7 million in bad debt expense, and $1.5 million of loss on foreign currency transactions.
The primary drivers of the change in operating assets and liabilities were a decrease in other current liabilities of $14.2 million, a decrease of $8.6 million in
accounts payable, a decrease in accrued compensation of $5.5 million, an increase in deferred sales commissions of $4.1 million, and an increase of $1.3
million in inventory, partially offset by a decrease in accounts receivable of $26.4 million and an increase of $16.9 million in deferred revenue. The decrease
in other current liabilities and accounts payable reflected our shift in strategy, which resulted in fewer obligations due for marketing, advertising, and rebates.
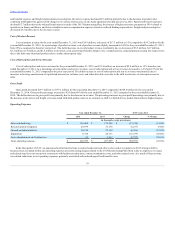
The decrease in accrued compensation was primarily attributable to the 2015 Restructuring Plan, which reduced global non-Enterprise & Education
headcount approximately 15% and led to a reduction in payroll, benefits, and variable compensation. The increase in deferred sales commission was
primarily attributable to the 2014 acquisitions and an increase in Lexia deferred commissions. Inventory increased due to missed forecasts on holiday season
sales orders resulting in additional inventory on hand. The decrease in accounts receivable was primarily related to the higher sales during the fourth quarter
2014 holiday season as compared to 2015. The increase in deferred revenue was primarily to a higher mix of Consumer revenue associated with web-based
software subscription services and to a lesser extent the purchase accounting impacts related to the 2014 acquisitions.
Net cash provided by operating activities for the year ended December 31, 2014 was $6.7 million. The primary factors affecting our operating cash
flows during the year were our net loss of $73.7 million, which were offset by non-cash charges totaling $37.1 million, and a favorable overall change in
operating assets and liabilities of $43.3 million. Non-cash items primarily consisted of $20.3 million in impairment loss, $13.9 million in depreciation and
amortization expense, $6.8 million in stock-based compensation expense, and $2.4 million in bad debt expense, only slightly offset by a deferred income tax
benefit
47