Rosetta Stone 2015 Annual Report Download - page 41
Download and view the complete annual report
Please find page 41 of the 2015 Rosetta Stone annual report below. You can navigate through the pages in the report by either clicking on the pages listed below, or by using the keyword search tool below to find specific information within the annual report.-
 1
1 -
2
-
3
-
4
-
5
-
6
-
7
-
8
-
9
-
10
-
11
-
12
-
13
-
14
-
15
-
16
-
17
-
18
-
19
-
20
-
21
-
22
-
23
-
24
-
25
-
26
-
27
-
28
-
29
-
30
-
 31
31 -
 32
32 -
 33
33 -
 34
34 -
 35
35 -
 36
36 -
 37
37 -
 38
38 -
 39
39 -
 40
40 -
 41
41 -
 42
42 -
 43
43 -
 44
44 -
 45
45 -
 46
46 -
 47
47 -
 48
48 -
 49
49 -
 50
50 -
 51
51 -
52
-
53
-
54
-
55
-
56
-
57
-
58
-
59
-
60
-
61
-
62
-
63
-
64
-
65
-
66
-
67
-
68
-
69
-
70
-
71
-
72
-
73
-
74
-
75
-
76
-
77
-
78
-
79
-
80
-
81
-
82
-
83
-
84
-
85
-
86
-
87
-
88
-
89
-
90
-
91
-
92
-
93
-
94
-
95
-
96
-
97
-
98
-
99
-
100
-
101
-
102
-
103
-
104
-
105
-
106
-
107
-
108
-
109
-
110
-
111
-
112
-
113
-
114
-
115
-
116
-
117
-
118
-
119
-
120
-
121
-
122
-
123
-
124
-
125
-
126
-
127
-
128
-
129
-
130
-
131
-
132
-
133
-
134
-
135
-
136
-
137
-
138
-
139
-
140
-
141
-
142
-
143
-
144
-
145
-
146
-
147
-
148
-
149
-
150
-
151
-
152
-
153
-
154
-
155
 |
 |

Table of Contents
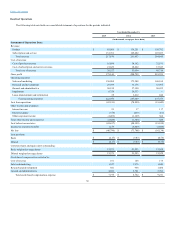
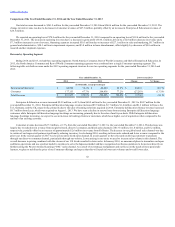
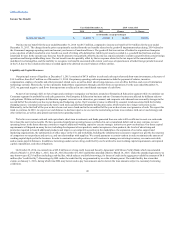
The following table presents restructuring costs associated with the 2015 Restructuring Plan included in the related line items of our results from
operations:
Cost of revenue
$ 113
$ —
Sales and marketing
4,492
—
Research and development
602
—
General and administrative
3,584
—
Total
$ 8,791
$ —
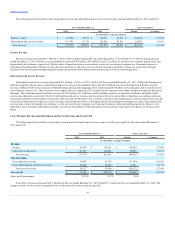
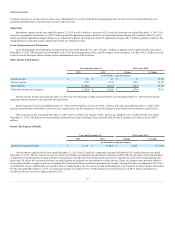
Sales and Marketing Expenses
Sales and marketing expenses for the year ended December 31, 2015 were $136.1 million, a decrease of $37.1 million, or 21%, from the year ended
December 31, 2014. As a percentage of total revenue, sales and marketing expenses decreased to 63% for the year ended December 31, 2015, from 66% for
the year ended December 31, 2014. The dollar and percentage decreases in sales and marketing expenses were primarily due to decreases in media and
marketing expenses, payroll and benefit expenses, professional services, and amortization expense, which were partially offset by an increase in commission
expense. Media spend decreased $27.1 million due to a decrease of $17.2 million in spend from offline media like TV, radio, and print and a $9.9 million
decrease in spend in online and social media expenses. Marketing expenses also decreased by $5.7 million due to decreased spend in creative development
and advertising expenses as a result of the strategic shift in focus and the positioning of the Consumer business for profitability. Payroll and benefit expense
decreased $4.1 million due to salary savings from the reduced headcount as a result of the 2015 Restructuring Plan, lower variable incentive compensation
expenses based on reduced funding expectations, and the absence of Long Term Incentive Plan ("LTIP") expense as the plan ended in 2014. Professional
services decreased $2.9 million due to reduced outsourced staffing in the call centers as a result of the strategic shift in the Consumer segment. Amortization
expense decreased $1.2 million due to the fully depreciated Tell Me More trade name at the end of 2014. Commission expense increased $4.5 million
primarily driven by an increase in Enterprise & Education literacy revenue. In connection with our 2016 strategy, we intend to continue to optimize our
Consumer media and marketing costs and manage the Consumer business for profitability and plan to manage the sales and marketing expenses to drive
these results.
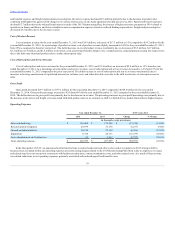
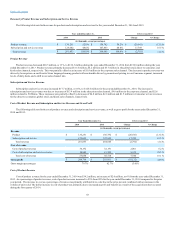
Research and Development Expenses
Research and development expenses were $29.9 million for the year ended December 31, 2015, a decrease of $3.2 million, or 10%, from the year ended
December 31, 2014. As a percentage of revenue, research and development expenses increased slightly to 14% from 13% for the years ended December 31,
2015 and 2014, respectively. The dollar decrease was primarily due to a reduction in payroll and benefits expense of $2.3 million due to the headcount
reductions from the 2015 Restructuring Plan, coupled with a $1.2 million reduction in costs associated with the Kids Reading and Kids Storytime projects
that were released in the second half of 2014 or put on hold in the first half of 2015, respectively. In accordance with our shift in strategy, we continue to
focus our product investment on the development of the Language Learning Suite for Enterprise, a single solution that will integrate our foundations,
advantage and advanced English for business products, enhance our reporting and administrator tools and extend our assessment capabilities. We expect to
maintain our current level of investment in our research and development expenses as we address these initiatives.
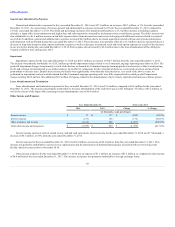
General and Administrative Expenses
General and administrative expenses for the year ended December 31, 2015 were $50.1 million, a decrease of $7.0 million, or 12%, from the year ended
December 31, 2014. As a percentage of revenue, general and administrative expenses increased slightly to 23% for the year ended December 31, 2015
compared to 22% for year ended December 31, 2014. The dollar decrease was primarily due to reductions in payroll and benefits, third party services, bad
debt, communications, travel, and other expenses. Payroll and benefits decreased $2.5 million driven by the reduction in headcount related to the 2015
Restructuring Plan, lower variable incentive compensation expense due to the reduction in employees, and the absence of LTIP expense as the plan ended in
2014, partially offset by increases in severance and stock compensation expenses related to the change in CEO effective April 1, 2015. Third party services
expense decreased $1.9 million mainly driven by decreased software and hardware maintenance expenses in 2015. Bad debt expense decreased by $0.8
million due to improvements in accounts receivable aging as compared to 2014. Communications expense decreased $0.5 million due to cost savings
identified related to hosting, network, and telephone charges. Travel expenses decreased $0.5 million as a result of the international trips in support of
acquisition related activities in the first quarter of 2014. We expect our general and administrative expenses to
40