Rosetta Stone 2015 Annual Report Download - page 38
Download and view the complete annual report
Please find page 38 of the 2015 Rosetta Stone annual report below. You can navigate through the pages in the report by either clicking on the pages listed below, or by using the keyword search tool below to find specific information within the annual report.-
 1
1 -
2
-
3
-
4
-
5
-
6
-
7
-
8
-
9
-
10
-
11
-
12
-
13
-
14
-
15
-
16
-
17
-
18
-
19
-
20
-
21
-
22
-
23
-
24
-
25
-
26
-
27
-
 28
28 -
 29
29 -
 30
30 -
 31
31 -
 32
32 -
 33
33 -
 34
34 -
 35
35 -
 36
36 -
 37
37 -
 38
38 -
 39
39 -
 40
40 -
 41
41 -
 42
42 -
 43
43 -
 44
44 -
 45
45 -
 46
46 -
 47
47 -
 48
48 -
49
-
50
-
51
-
52
-
53
-
54
-
55
-
56
-
57
-
58
-
59
-
60
-
61
-
62
-
63
-
64
-
65
-
66
-
67
-
68
-
69
-
70
-
71
-
72
-
73
-
74
-
75
-
76
-
77
-
78
-
79
-
80
-
81
-
82
-
83
-
84
-
85
-
86
-
87
-
88
-
89
-
90
-
91
-
92
-
93
-
94
-
95
-
96
-
97
-
98
-
99
-
100
-
101
-
102
-
103
-
104
-
105
-
106
-
107
-
108
-
109
-
110
-
111
-
112
-
113
-
114
-
115
-
116
-
117
-
118
-
119
-
120
-
121
-
122
-
123
-
124
-
125
-
126
-
127
-
128
-
129
-
130
-
131
-
132
-
133
-
134
-
135
-
136
-
137
-
138
-
139
-
140
-
141
-
142
-
143
-
144
-
145
-
146
-
147
-
148
-
149
-
150
-
151
-
152
-
153
-
154
-
155
 |
 |

Table of Contents
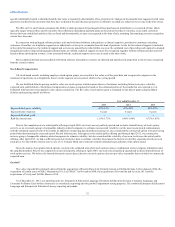
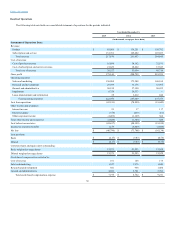
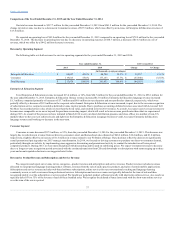
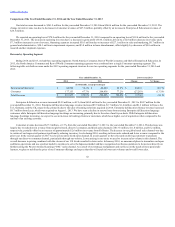
Our total revenue decreased to $217.7 million for the year ended December 31, 2015 from $261.9 million for the year ended December 31, 2014. The
change in total revenue was due to a decrease in Consumer revenues of $57.5 million, which was offset by an increase in Enterprise & Education revenue of
$13.4 million.
We reported an operating loss of $43.8 million for the year ended December 31, 2015 compared to an operating loss of $78.9 million for the year ended
December 31, 2014. The decrease in operating loss was due to a decrease in operating expenses of $64.7 million, a decrease of $14.5 million in cost of
revenue, which was offset by a $44.2 million decrease in revenue.
The following table sets forth revenue for our two operating segments for the years ended December 31, 2015 and 2014:
Enterprise & Education
$ 98,057
45.0%
$ 84,700
32.3%
$ 13,357
15.8 %
Consumer
119,613
55.0%
177,153
67.7%
$ (57,540)
(32.5)%
Total Revenue
$ 217,670
100.0%
$ 261,853
100.0%
$ (44,183)
(16.9)%
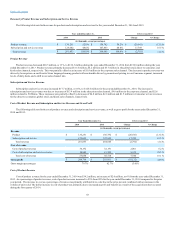
Enterprise & Education Segment
Total Enterprise & Education revenue increased $13.4 million, or 16%, from $84.7 million for the year ended December 31, 2014 to $98.1 million for
the year ended December 31, 2015. Enterprise & Education literacy revenue increased $12.0 million. Enterprise & Education language revenue increased
$1.3 million, comprised primarily of increases of $3.7 million and $0.8 million in our education and non-profit sales channels, respectively, which were
partially offset by a decrease of $2.9 million in the corporate sales channel. Enterprise & Education revenue increased, in part, due to the revenue recognition
of subscription service contracts recorded as deferred revenue in prior periods. Due to purchase accounting, deferred revenue associated with Lexia and Tell
Me More was recorded at fair value, which is lower than the book value, and resulted in lower 2014 revenue. As a result, we expect year-over-year revenues to
become more comparable as we move beyond the purchase accounting impact, which will result in lower revenue growth rates than what we experienced
during 2015. As a result of the process we have initiated in March 2016 to exit our direct distribution presence and close offices in a number of non-U.S.
markets where we have not yet achieved scale and right-size the Enterprise & Education Language business overall, we expect Enterprise & Education
language revenue and bookings to decrease in the near-term.
Consumer Segment
Consumer revenue decreased $57.5 million, or 32%, from the year ended December 31, 2014 to the year ended December 31, 2015. This decrease was
largely due to reductions in revenue from our direct-to-consumer, retail, and homeschool sales channels of $48.2 million, $10.4 million, and $1.0 million,
respectively, slightly offset by an increase of $1.6 million in revenue related to our Fit Brains offerings. These declines reflect the decision to significantly
curtail promotional pricing under our 2015 strategic transformation. In 2014, we focused on driving customers to purchase our direct-to-consumer channel,
particularly through our website, by implementing more aggressive discounting and promotional activity to combat the introduction of lower priced
competitor products. During 2015, we were more disciplined with discounting and focused on stabilizing prices. We expect Consumer revenues to decrease
due to a longer revenue recognition period associated with the continued transition from CDs and downloads to subscriptions with terms ranging up to three
years and an anticipated reduction in our suggested retail value.
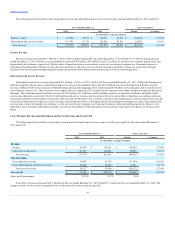
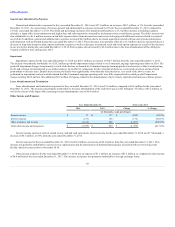
We categorize and report our revenue in two categories—product revenue and subscription and service revenue. Product revenue includes revenues
allocated to our perpetual language-learning product software, revenues from the sale of audio practice products, and sales of certain mobile applications.
Subscription and service revenue includes web-based software subscriptions, online services for our conversational coaching and language-learning
community access, as well as revenues from professional services. Subscription and service revenues are typically deferred at the time of sale and then
recognized ratably over the subscription or service period. We bundle our perpetual product software typically with short-term online services. As a result, we
typically defer 10% to 35% of the revenue of each of these bundled sales. We recognize the deferred revenue associated with the short-term online services
over the term of the service period
37