Rosetta Stone 2015 Annual Report Download - page 63
Download and view the complete annual report
Please find page 63 of the 2015 Rosetta Stone annual report below. You can navigate through the pages in the report by either clicking on the pages listed below, or by using the keyword search tool below to find specific information within the annual report.-
 1
1 -
2
-
3
-
4
-
5
-
6
-
7
-
8
-
9
-
10
-
11
-
12
-
13
-
14
-
15
-
16
-
17
-
18
-
19
-
20
-
21
-
22
-
23
-
24
-
25
-
26
-
27
-
28
-
29
-
30
-
31
-
32
-
33
-
34
-
35
-
36
-
37
-
38
-
39
-
40
-
41
-
42
-
43
-
44
-
45
-
46
-
47
-
48
-
49
-
50
-
51
-
52
-
 53
53 -
 54
54 -
 55
55 -
 56
56 -
 57
57 -
 58
58 -
 59
59 -
 60
60 -
 61
61 -
 62
62 -
 63
63 -
 64
64 -
 65
65 -
 66
66 -
 67
67 -
 68
68 -
 69
69 -
 70
70 -
 71
71 -
 72
72 -
 73
73 -
74
-
75
-
76
-
77
-
78
-
79
-
80
-
81
-
82
-
83
-
84
-
85
-
86
-
87
-
88
-
89
-
90
-
91
-
92
-
93
-
94
-
95
-
96
-
97
-
98
-
99
-
100
-
101
-
102
-
103
-
104
-
105
-
106
-
107
-
108
-
109
-
110
-
111
-
112
-
113
-
114
-
115
-
116
-
117
-
118
-
119
-
120
-
121
-
122
-
123
-
124
-
125
-
126
-
127
-
128
-
129
-
130
-
131
-
132
-
133
-
134
-
135
-
136
-
137
-
138
-
139
-
140
-
141
-
142
-
143
-
144
-
145
-
146
-
147
-
148
-
149
-
150
-
151
-
152
-
153
-
154
-
155
 |
 |

Table of Contents
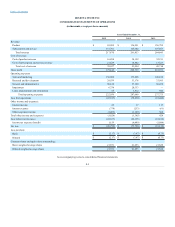
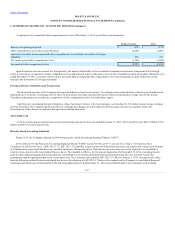
Net loss
$ (46,796)
$ (73,706)
$ (16,134)
Adjustments to reconcile net loss to cash (used in) provided by operating activities:
Stock-based compensation expense
7,195
6,762
9,241
Loss (gain) on foreign currency transactions
1,471
1,171
—
Bad debt expense
1,657
2,405
1,420
Depreciation and amortization
13,660
13,904
9,635
Deferred income tax expense (benefit)
849
(7,667)
(3,869)
(Gain) loss on disposal of equipment
(15)
184
278
Amortization of deferred financing costs
160
21
—
Loss on impairment
6,754
20,333
—
Loss from equity method investments
23
—
—
Gain on divestiture of subsidiary
(660)
—
—
Net change in:
Restricted cash
43
(13)
(37)
Accounts receivable
26,376
(16,478)
(9,477)
Inventory
(1,253)
341
(108)
Deferred sales commissions
(4,121)
(7,268)
(4,245)
Prepaid expenses and other current assets
1,080
1,844
(878)
Income tax receivable
568
(147)
827
Other assets
(684)
446
(68)
Accounts payable
(8,636)
8,394
3,702
Accrued compensation
(5,485)
(4,494)
(897)
Other current liabilities
(14,223)
11,318
4,250
Other long-term liabilities
(486)
459
481
Deferred revenue
16,878
48,864
13,947
Net cash (used in) provided by operating activities
(5,645)
6,673
8,068
Purchases of property and equipment
(8,856)
(9,736)
(8,941)
Proceeds from sale of fixed assets
1,642
—
—
Decrease (increase) in restricted cash for Vivity acquisition
—
12,314
(12,314)
Acquisitions, net of cash acquired
(1,688)
(41,687)
(25,675)
Net cash outflow from divestiture of subsidiary
(186)
—
—
Other investing activities
(286)
—
—
Net cash used in investing activities
(9,374)
(39,109)
(46,930)
Proceeds from the exercise of stock options
114
669
2,457
Repurchase of shares from exercised stock options
—
—
(1,040)
Purchase of treasury stock
—
—
(11,435)
Proceeds from equity offering, net of issuance costs
—
—
(228)
Deferred financing costs
(130)
(381)
—
Payments under capital lease obligations
(711)
(593)
(241)
Net cash used in financing activities
(727)
(305)
(10,487)
Increase (decrease) in cash and cash equivalents
(15,746)
(32,741)
(49,349)
Effect of exchange rate changes in cash and cash equivalents
(1,129)
(1,427)
(16)
Net increase (decrease) in cash and cash equivalents
(16,875)
(34,168)
(49,365)
Cash and cash equivalents—beginning of year
64,657
98,825
148,190
Cash and cash equivalents—end of year
$ 47,782
$ 64,657
$ 98,825
Cash paid during the periods for:
Interest
$ 218
$ 211
$ 18
Income taxes, net of refund
$ 601
$ 1,722
$ 3,290
Noncash financing and investing activities: