Rosetta Stone 2015 Annual Report Download - page 44
Download and view the complete annual report
Please find page 44 of the 2015 Rosetta Stone annual report below. You can navigate through the pages in the report by either clicking on the pages listed below, or by using the keyword search tool below to find specific information within the annual report.-
 1
1 -
2
-
3
-
4
-
5
-
6
-
7
-
8
-
9
-
10
-
11
-
12
-
13
-
14
-
15
-
16
-
17
-
18
-
19
-
20
-
21
-
22
-
23
-
24
-
25
-
26
-
27
-
28
-
29
-
30
-
31
-
32
-
33
-
 34
34 -
 35
35 -
 36
36 -
 37
37 -
 38
38 -
 39
39 -
 40
40 -
 41
41 -
 42
42 -
 43
43 -
 44
44 -
 45
45 -
 46
46 -
 47
47 -
 48
48 -
 49
49 -
 50
50 -
 51
51 -
 52
52 -
 53
53 -
 54
54 -
55
-
56
-
57
-
58
-
59
-
60
-
61
-
62
-
63
-
64
-
65
-
66
-
67
-
68
-
69
-
70
-
71
-
72
-
73
-
74
-
75
-
76
-
77
-
78
-
79
-
80
-
81
-
82
-
83
-
84
-
85
-
86
-
87
-
88
-
89
-
90
-
91
-
92
-
93
-
94
-
95
-
96
-
97
-
98
-
99
-
100
-
101
-
102
-
103
-
104
-
105
-
106
-
107
-
108
-
109
-
110
-
111
-
112
-
113
-
114
-
115
-
116
-
117
-
118
-
119
-
120
-
121
-
122
-
123
-
124
-
125
-
126
-
127
-
128
-
129
-
130
-
131
-
132
-
133
-
134
-
135
-
136
-
137
-
138
-
139
-
140
-
141
-
142
-
143
-
144
-
145
-
146
-
147
-
148
-
149
-
150
-
151
-
152
-
153
-
154
-
155
 |
 |

Table of Contents
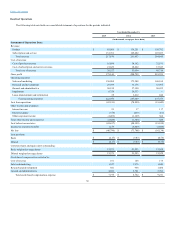
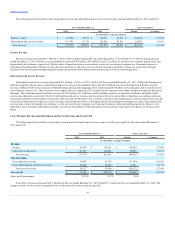
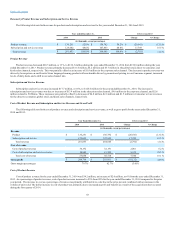
Revenue by Product Revenue and Subscription and Service Revenue
The following table sets forth revenue for products and subscription and services for the years ended December 31, 2014 and 2013:
Product revenue
$ 136,251
52.0%
$ 156,792
59.2%
$ (20,541)
(13.1)%
Subscription and service revenue
125,602
48.0%
107,853
40.8%
17,749
16.5 %
Total revenue
$ 261,853
100.0%
$ 264,645
100.0%
$ (2,792)
(1.1)%
Product Revenue
Product revenue decreased $20.5 million, or 13%, to $136.3 million during the year ended December 31, 2014 from $156.8 million during the year
ended December 31, 2013. Product revenue primarily decreased $11.6 million, $6.2 million and $3.7 million in the global retail, direct-to-consumer, and
kiosk sales channels, respectively. This was partially offset by an increase of $1.8 million in the corporate sales channel. The decrease in product revenue was
driven by lower prices on our Rosetta Stone language-learning product software bundle driven by promotional pricing in our Consumer segment, increased
levels of daily deals, and a shift in our sales channel mix.
Subscription and Service Revenue
Subscription and service revenue increased $17.7 million, or 16%, to $125.6 million for the year ended December 31, 2014. The increase in
subscription and service revenues was due to increases of $13.9 million in the education sales channel, $9.0 million in the corporate channel, and $2.6
million related to Fit Brains. These increases were partially offset by decreases of $4.8 million, $2.6 million and $1.5 million in Consumer service revenues
for the direct-to-consumer, global retail, and kiosk sales channels, respectively.
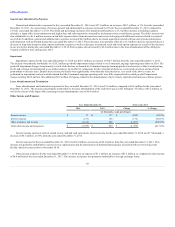
The following table sets forth cost of product revenue and subscription and service revenue, as well as gross profit for the years ended December 31,
2014 and 2013:
Product
$ 136,251
$ 156,792
$ (20,541)
(13.1)%
Subscription and service
125,602
107,853
17,749
16.5 %
Total revenue
261,853
264,645
(2,792)
(1.1)%
Cost of product revenue
34,192
32,191
2,001
6.2 %
Cost of subscription and service revenue
18,862
13,523
5,339
39.5 %
Total cost of revenue
53,054
45,714
7,340
16.1 %
$ 208,799
$ 218,931
$ (10,132)
(4.6)%
Gross margin percentages
79.7%
82.7%
(3.0)%
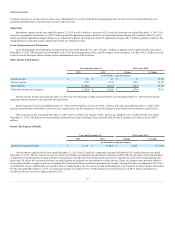
Cost of Product Revenue
Cost of product revenue for the year ended December 31, 2014 was $34.2 million, an increase of $2.0 million, or 6% from the year ended December 31,
2013. As a percentage of product revenue, cost of product revenue increased to 25% from 20% for the year ended December 31, 2014 compared to the prior
year period. The increase in cost as a percentage of revenue was primarily attributable to a decline in the price per unit combined with an increase in the
volume of units sold. The dollar increase in cost of product was primarily due to increased payroll and benefits as a result of the acquisitions that occurred
during the first quarter of 2014.
43