Rosetta Stone 2015 Annual Report Download - page 37
Download and view the complete annual report
Please find page 37 of the 2015 Rosetta Stone annual report below. You can navigate through the pages in the report by either clicking on the pages listed below, or by using the keyword search tool below to find specific information within the annual report.-
 1
1 -
2
-
3
-
4
-
5
-
6
-
7
-
8
-
9
-
10
-
11
-
12
-
13
-
14
-
15
-
16
-
17
-
18
-
19
-
20
-
21
-
22
-
23
-
24
-
25
-
26
-
 27
27 -
 28
28 -
 29
29 -
 30
30 -
 31
31 -
 32
32 -
 33
33 -
 34
34 -
 35
35 -
 36
36 -
 37
37 -
 38
38 -
 39
39 -
 40
40 -
 41
41 -
 42
42 -
 43
43 -
 44
44 -
 45
45 -
 46
46 -
 47
47 -
48
-
49
-
50
-
51
-
52
-
53
-
54
-
55
-
56
-
57
-
58
-
59
-
60
-
61
-
62
-
63
-
64
-
65
-
66
-
67
-
68
-
69
-
70
-
71
-
72
-
73
-
74
-
75
-
76
-
77
-
78
-
79
-
80
-
81
-
82
-
83
-
84
-
85
-
86
-
87
-
88
-
89
-
90
-
91
-
92
-
93
-
94
-
95
-
96
-
97
-
98
-
99
-
100
-
101
-
102
-
103
-
104
-
105
-
106
-
107
-
108
-
109
-
110
-
111
-
112
-
113
-
114
-
115
-
116
-
117
-
118
-
119
-
120
-
121
-
122
-
123
-
124
-
125
-
126
-
127
-
128
-
129
-
130
-
131
-
132
-
133
-
134
-
135
-
136
-
137
-
138
-
139
-
140
-
141
-
142
-
143
-
144
-
145
-
146
-
147
-
148
-
149
-
150
-
151
-
152
-
153
-
154
-
155
 |
 |

Table of Contents
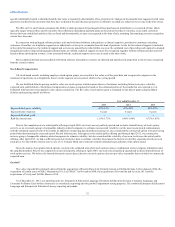
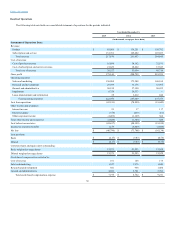
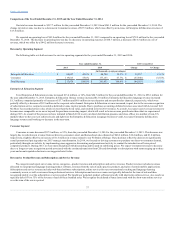
The following table sets forth our consolidated statement of operations for the periods indicated.
Revenue:
Product
$ 65,969
$ 136,251
$ 156,792
Subscription and service
151,701
125,602
107,853
Total revenue
217,670
261,853
264,645
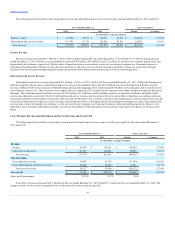
Cost of revenue:
Cost of product revenue
16,898
34,192
32,191
Cost of subscription and service revenue
21,629
18,862
13,523
Total cost of revenue
38,527
53,054
45,714
Gross profit
179,143
208,799
218,931
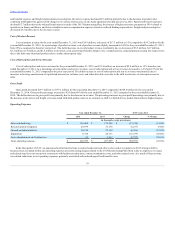
Operating expenses
Sales and marketing
136,084
173,208
146,104
Research and development
29,939
33,176
33,995
General and administrative
50,124
57,120
56,432
Impairment
6,754
20,333
—
Lease abandonment and termination
55
3,812
842
Total operating expenses
222,956
287,649
237,373
Loss from operations
(43,813)
(78,850)
(18,442)
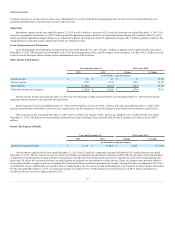
Other income and (expense):
Interest income
23
17
117
Interest expense
(378)
(233)
(61)
Other (expense) income
(1,469)
(1,129)
368
Total other income and (expense)
(1,824)
(1,345)
424
Loss before income taxes
(45,637)
(80,195)
(18,018)
Income tax expense (benefit)
1,159
(6,489)
(1,884)
Net loss
$ (46,796)
$ (73,706)
$ (16,134)
Loss per share:
Basic
$ (2.17)
$ (3.47)
(0.75)
Diluted
$ (2.17)
$ (3.47)
$ (0.75)
Common shares and equivalents outstanding:
Basic weighted average shares
21,571
21,253
21,528
Diluted weighted average shares
21,571
21,253
21,528
Cost of revenue
101
108
175
Sales and marketing
1,327
1,975
1,840
Research and development
841
958
1,460
General and administrative
4,926
3,721
5,766
Total stock-based compensation expense
$ 7,195
$ 6,762
$ 9,241
36