Rosetta Stone 2009 Annual Report Download - page 81
Download and view the complete annual report
Please find page 81 of the 2009 Rosetta Stone annual report below. You can navigate through the pages in the report by either clicking on the pages listed below, or by using the keyword search tool below to find specific information within the annual report.-
 1
1 -
2
-
3
-
4
-
5
-
6
-
7
-
8
-
9
-
10
-
11
-
12
-
13
-
14
-
15
-
16
-
17
-
18
-
19
-
20
-
21
-
22
-
23
-
24
-
25
-
26
-
27
-
28
-
29
-
30
-
31
-
32
-
33
-
34
-
35
-
36
-
37
-
38
-
39
-
40
-
41
-
42
-
43
-
44
-
45
-
46
-
47
-
48
-
49
-
50
-
51
-
52
-
53
-
54
-
55
-
56
-
57
-
58
-
59
-
60
-
61
-
62
-
63
-
64
-
65
-
66
-
67
-
68
-
69
-
70
-
 71
71 -
 72
72 -
 73
73 -
 74
74 -
 75
75 -
 76
76 -
 77
77 -
 78
78 -
 79
79 -
 80
80 -
 81
81 -
 82
82 -
 83
83 -
 84
84 -
 85
85 -
 86
86 -
 87
87 -
 88
88 -
 89
89 -
 90
90 -
 91
91 -
92
-
93
-
94
-
95
-
96
-
97
-
98
-
99
-
100
-
101
-
102
-
103
-
104
-
105
-
106
-
107
-
108
-
109
-
110
-
111
-
112
-
113
-
114
-
115
-
116
-
117
-
118
-
119
-
120
-
121
-
122
-
123
-
124
-
125
-
126
-
127
-
128
 |
 |

Table of Contents
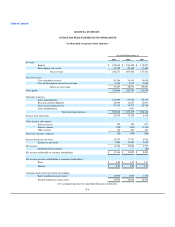
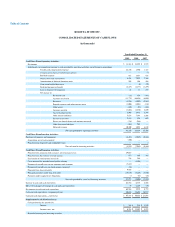
ROSETTA STONE INC.
CONSOLIDATED STATEMENTS OF CASH FLOWS
(in thousands)
Year Ended December 31,
2009 2008 2007
Cash Flows From Operating Activities:
Net income $ 13,363 $ 13,892 $ 2,579
Adjustments to reconcile net income to cash provided by operating activities, net of business acquisitions
Stock-based compensation expense 22,150 1,590 1,327
Compensation expense related to put-options — — (7)
Bad debt expense 911 1,611 828
Depreciation and amortization 5,428 7,075 7,769
Amortization of deferred financing costs 209 104 104
Gain on embedded derivative — (4) (29)
Deferred income tax benefit (2,475) (2,177) (1,299)
Loss on disposal of equipment 42 17 193
Net change in:
Restricted cash (16) 359 (383)
Accounts receivable (11,779) (16,494) (4,010)
Inventory (3,916) (1,092) (2,563)
Prepaid expenses and other current assets (1,006) (1,041) (139)
Other assets (429) (91) (169)
Accounts payable (1,604) (1,430) 2,630
Accrued compensation 1,905 3,933 1,348
Other current liabilities 5,678 7,393 2,108
Income tax payable 3,188 925 652
Excess tax benefit from stock options exercised (336) (246) —
Other long-term liabilities (463) 963 —
Deferred revenue 10,300 3,051 4,830
Net cash provided by operating activities 41,150 18,338 15,769
Cash Flows From Investing Activities:
Purchases of property and equipment (8,455) (7,019) (9,167)
Acquisition, net of cash acquired (100) — —
Proceeds from employee and stockholder loans — — 2
Net cash used in investing activities (8,555) (7,019) (9,165)
Cash Flows From Financing Activities:
Proceeds from common stock issuance, net of issuance costs 49,037 — —
Proceeds from the exercise of stock options 473 365 765
Tax benefit of stock options exercised 336 246 —
Costs incurred for intended initial public offering — (1,801) —
Payment of payroll taxes on net common stock issuance (7,887) — —
Payment of payroll taxes on stock options exercised (89) — —
Proceeds from long-term debt 9,929 — —
Principal payments under long-term debt (19,839) (3,402) (2,550)
Payments under capital lease obligations (3) (12) (16)
Net cash provided by (used in) financing activities 31,957 (4,604) (1,801)
Increase in cash and cash equivalents 64,552 6,715 4,803
Effect of exchange rate changes in cash and cash equivalents 10 2,220 (29)
Net increase in cash and cash equivalents 64,562 8,935 4,774
Cash and cash equivalents—beginning of year 30,626 21,691 16,917
Cash and cash equivalents—end of year $ 95,188 $ 30,626 $ 21,691
Supplemental Cash Flow Disclosure:
Cash paid during the periods for:
Interest $ 104 $ 936 $ 1,259
Income taxes, net $ 6,364 $ 14,642 $ 4,821
Noncash financing and investing activities: