Rosetta Stone 2009 Annual Report Download - page 62
Download and view the complete annual report
Please find page 62 of the 2009 Rosetta Stone annual report below. You can navigate through the pages in the report by either clicking on the pages listed below, or by using the keyword search tool below to find specific information within the annual report.-
 1
1 -
2
-
3
-
4
-
5
-
6
-
7
-
8
-
9
-
10
-
11
-
12
-
13
-
14
-
15
-
16
-
17
-
18
-
19
-
20
-
21
-
22
-
23
-
24
-
25
-
26
-
27
-
28
-
29
-
30
-
31
-
32
-
33
-
34
-
35
-
36
-
37
-
38
-
39
-
40
-
41
-
42
-
43
-
44
-
45
-
46
-
47
-
48
-
49
-
50
-
51
-
 52
52 -
 53
53 -
 54
54 -
 55
55 -
 56
56 -
 57
57 -
 58
58 -
 59
59 -
 60
60 -
 61
61 -
 62
62 -
 63
63 -
 64
64 -
 65
65 -
 66
66 -
 67
67 -
 68
68 -
 69
69 -
 70
70 -
 71
71 -
 72
72 -
73
-
74
-
75
-
76
-
77
-
78
-
79
-
80
-
81
-
82
-
83
-
84
-
85
-
86
-
87
-
88
-
89
-
90
-
91
-
92
-
93
-
94
-
95
-
96
-
97
-
98
-
99
-
100
-
101
-
102
-
103
-
104
-
105
-
106
-
107
-
108
-
109
-
110
-
111
-
112
-
113
-
114
-
115
-
116
-
117
-
118
-
119
-
120
-
121
-
122
-
123
-
124
-
125
-
126
-
127
-
128
 |
 |

Table of Contents
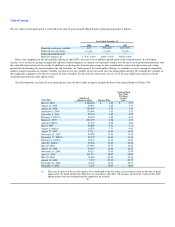
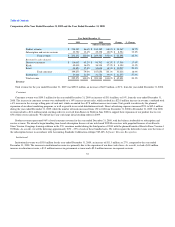
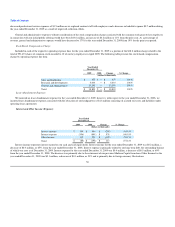
Cost of Revenue and Gross Profit
Year Ended December 31,
2008 2007 Change % Change
(dollars in thousands)
Revenue:
Product $ 184,182 $ 119,897 $ 64,285 53.6%
Subscription and service 25,198 17,424 $ 7,774 44.6%
Total revenue $ 209,380 $ 137,321 $ 72,059 52.5%
Cost of revenue:
Cost of product revenue $ 26,539 $ 19,055 $ 7,484 39.3%
Cost of subscription and service revenue 2,137 1,632 $ 505 30.9%
Total cost of revenue 28,676 20,687 7,989 38.6%
Gross profit $ 180,704 $ 116,634 $ 64,070
Gross margin percentages 86.3% 84.9% 1.4%
Cost of revenue for the year ended December 31, 2008 was $28.7 million, an increase of $8.0 million, or 39%, from the year ended December 31, 2007.
As a percentage of total revenue, cost of revenue was 14% for the year ended December 31, 2008 compared to 15% for the year ended December 31, 2007.
The dollar increase in cost of revenue was attributable to growth in unit sales. The increase in gross margin percentage was due to a $0.9 million write down
of inventory in the 2007 period associated with the transition from Version 2 to Version 3 product and packaging.
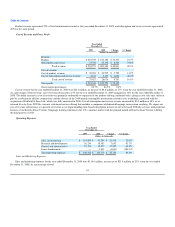
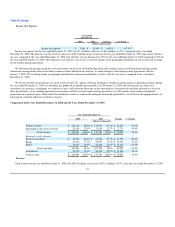
Operating Expenses
Year Ended December 31,
2008 2007 Change % Change
(dollars in thousands)
Sales and marketing $ 93,384 $ 65,437 $ 27,947 42.7%
Research and development 18,387 12,893 $ 5,494 42.6%
General and administrative 39,577 29,786 $ 9,791 32.9%
Lease abandonment 1,831 — $ 1,831 100.0%
Total operating expenses $ 153,179 $ 108,116 $ 45,063 41.7%
Sales and Marketing Expenses
Sales and marketing expenses for the year ended December 31, 2008 were $93.4 million, an increase of $27.9 million, or 43%, from the year ended
December 31, 2007. As a percentage of total revenue, sales and marketing expenses were 45% for the year ended December 31, 2008, compared to 48% for
the year ended December 31, 2007. The dollar increase in sales and marketing expenses was primarily attributable to the continued expansion of our direct
marketing activities. Advertising expenses grew by $9.3 million and were primarily related to the purchase of additional television media. We also expanded
the number of our kiosks from 86 as of December 31, 2007 to 150 as of December 31, 2008, which resulted in $7.9 million of additional kiosk operating
expenses, including sales compensation related expenses. Personnel costs related to growth in our institutional sales channel and marketing and sales support
activities also increased by $7.7 million.
59